Hopi vs Finnish Divorced or Separated
COMPARE
Hopi
Finnish
Divorced or Separated
Divorced or Separated Comparison
Hopi
Finns
13.2%
DIVORCED OR SEPARATED
0.0/ 100
METRIC RATING
304th/ 347
METRIC RANK
12.5%
DIVORCED OR SEPARATED
1.8/ 100
METRIC RATING
249th/ 347
METRIC RANK
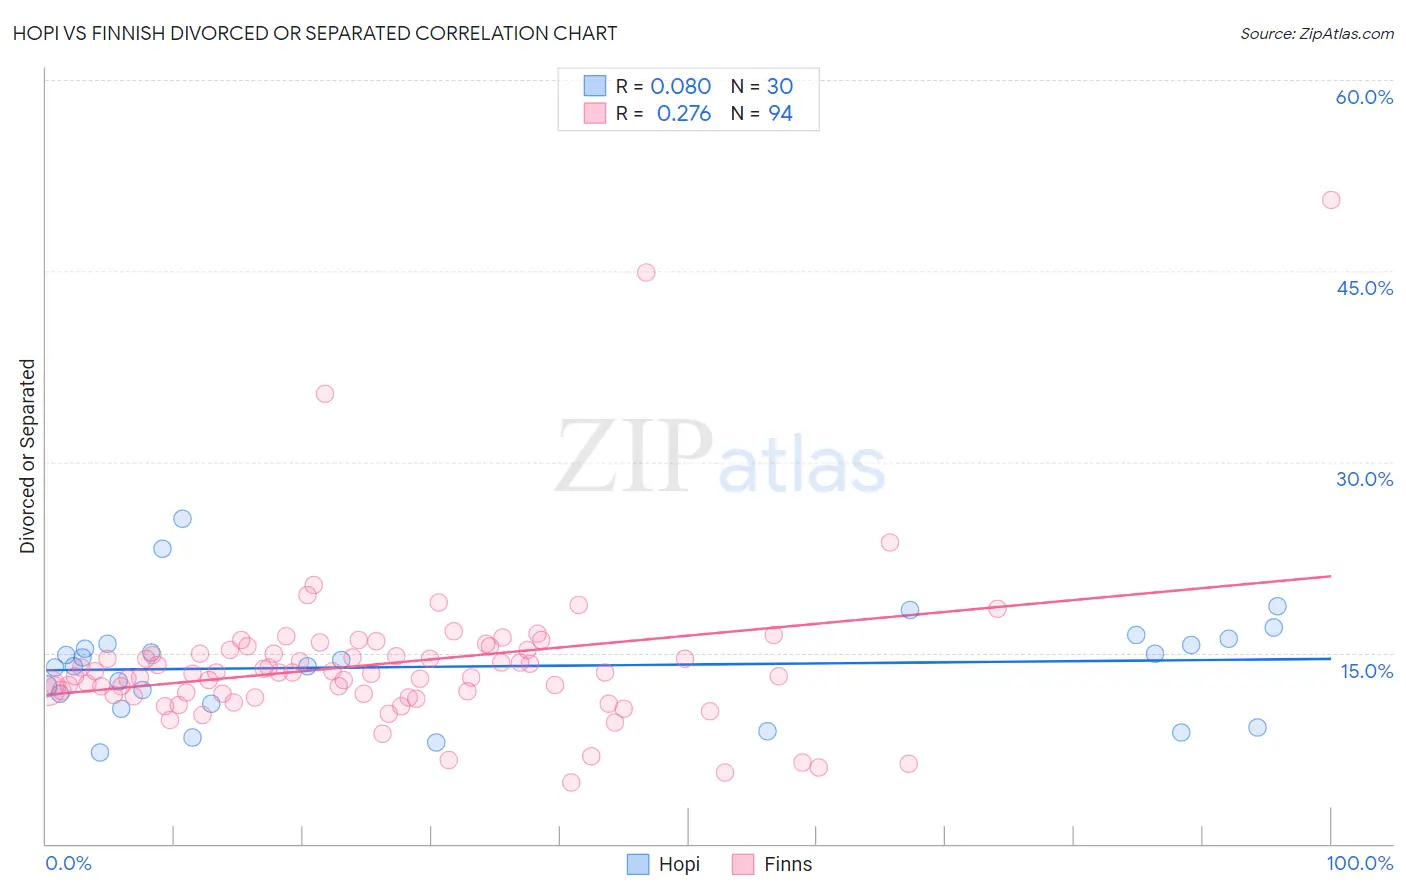
Hopi vs Finnish Divorced or Separated Correlation Chart
The statistical analysis conducted on geographies consisting of 74,740,168 people shows a slight positive correlation between the proportion of Hopi and percentage of population currently divorced or separated in the United States with a correlation coefficient (R) of 0.080 and weighted average of 13.2%. Similarly, the statistical analysis conducted on geographies consisting of 404,587,172 people shows a weak positive correlation between the proportion of Finns and percentage of population currently divorced or separated in the United States with a correlation coefficient (R) of 0.276 and weighted average of 12.5%, a difference of 5.4%.
Divorced or Separated Correlation Summary
| Measurement | Hopi | Finnish |
| Minimum | 7.2% | 4.8% |
| Maximum | 25.5% | 50.5% |
| Range | 18.3% | 45.7% |
| Mean | 13.9% | 14.1% |
| Median | 14.2% | 13.4% |
| Interquartile 25% (IQ1) | 11.0% | 11.7% |
| Interquartile 75% (IQ3) | 15.7% | 15.2% |
| Interquartile Range (IQR) | 4.7% | 3.5% |
| Standard Deviation (Sample) | 4.2% | 6.3% |
| Standard Deviation (Population) | 4.1% | 6.3% |
Similar Demographics by Divorced or Separated
Demographics Similar to Hopi by Divorced or Separated
In terms of divorced or separated, the demographic groups most similar to Hopi are Chippewa (13.2%, a difference of 0.050%), Cape Verdean (13.1%, a difference of 0.13%), Immigrants from Venezuela (13.1%, a difference of 0.15%), Tlingit-Haida (13.2%, a difference of 0.22%), and Alaskan Athabascan (13.1%, a difference of 0.25%).
| Demographics | Rating | Rank | Divorced or Separated |
| Natives/Alaskans | 0.0 /100 | #297 | Tragic 13.0% |
| Venezuelans | 0.0 /100 | #298 | Tragic 13.0% |
| Immigrants | Jamaica | 0.0 /100 | #299 | Tragic 13.0% |
| Immigrants | Cabo Verde | 0.0 /100 | #300 | Tragic 13.1% |
| Alaskan Athabascans | 0.0 /100 | #301 | Tragic 13.1% |
| Immigrants | Venezuela | 0.0 /100 | #302 | Tragic 13.1% |
| Cape Verdeans | 0.0 /100 | #303 | Tragic 13.1% |
| Hopi | 0.0 /100 | #304 | Tragic 13.2% |
| Chippewa | 0.0 /100 | #305 | Tragic 13.2% |
| Tlingit-Haida | 0.0 /100 | #306 | Tragic 13.2% |
| French American Indians | 0.0 /100 | #307 | Tragic 13.2% |
| Ottawa | 0.0 /100 | #308 | Tragic 13.2% |
| Americans | 0.0 /100 | #309 | Tragic 13.2% |
| Africans | 0.0 /100 | #310 | Tragic 13.2% |
| Sioux | 0.0 /100 | #311 | Tragic 13.2% |
Demographics Similar to Finns by Divorced or Separated
In terms of divorced or separated, the demographic groups most similar to Finns are Nepalese (12.5%, a difference of 0.010%), German (12.5%, a difference of 0.040%), Immigrants from West Indies (12.5%, a difference of 0.070%), Hispanic or Latino (12.5%, a difference of 0.090%), and Irish (12.5%, a difference of 0.27%).
| Demographics | Rating | Rank | Divorced or Separated |
| Dutch | 3.1 /100 | #242 | Tragic 12.4% |
| Immigrants | Latin America | 2.8 /100 | #243 | Tragic 12.4% |
| Alaska Natives | 2.5 /100 | #244 | Tragic 12.4% |
| Hispanics or Latinos | 2.0 /100 | #245 | Tragic 12.5% |
| Immigrants | West Indies | 1.9 /100 | #246 | Tragic 12.5% |
| Germans | 1.8 /100 | #247 | Tragic 12.5% |
| Nepalese | 1.8 /100 | #248 | Tragic 12.5% |
| Finns | 1.8 /100 | #249 | Tragic 12.5% |
| Irish | 1.3 /100 | #250 | Tragic 12.5% |
| Aleuts | 1.3 /100 | #251 | Tragic 12.5% |
| Liberians | 0.9 /100 | #252 | Tragic 12.6% |
| Somalis | 0.9 /100 | #253 | Tragic 12.6% |
| Senegalese | 0.8 /100 | #254 | Tragic 12.6% |
| Welsh | 0.7 /100 | #255 | Tragic 12.6% |
| Immigrants | Colombia | 0.6 /100 | #256 | Tragic 12.6% |