Hopi vs Immigrants from Iran Divorced or Separated
COMPARE
Hopi
Immigrants from Iran
Divorced or Separated
Divorced or Separated Comparison
Hopi
Immigrants from Iran
13.2%
DIVORCED OR SEPARATED
0.0/ 100
METRIC RATING
304th/ 347
METRIC RANK
10.6%
DIVORCED OR SEPARATED
100.0/ 100
METRIC RATING
18th/ 347
METRIC RANK
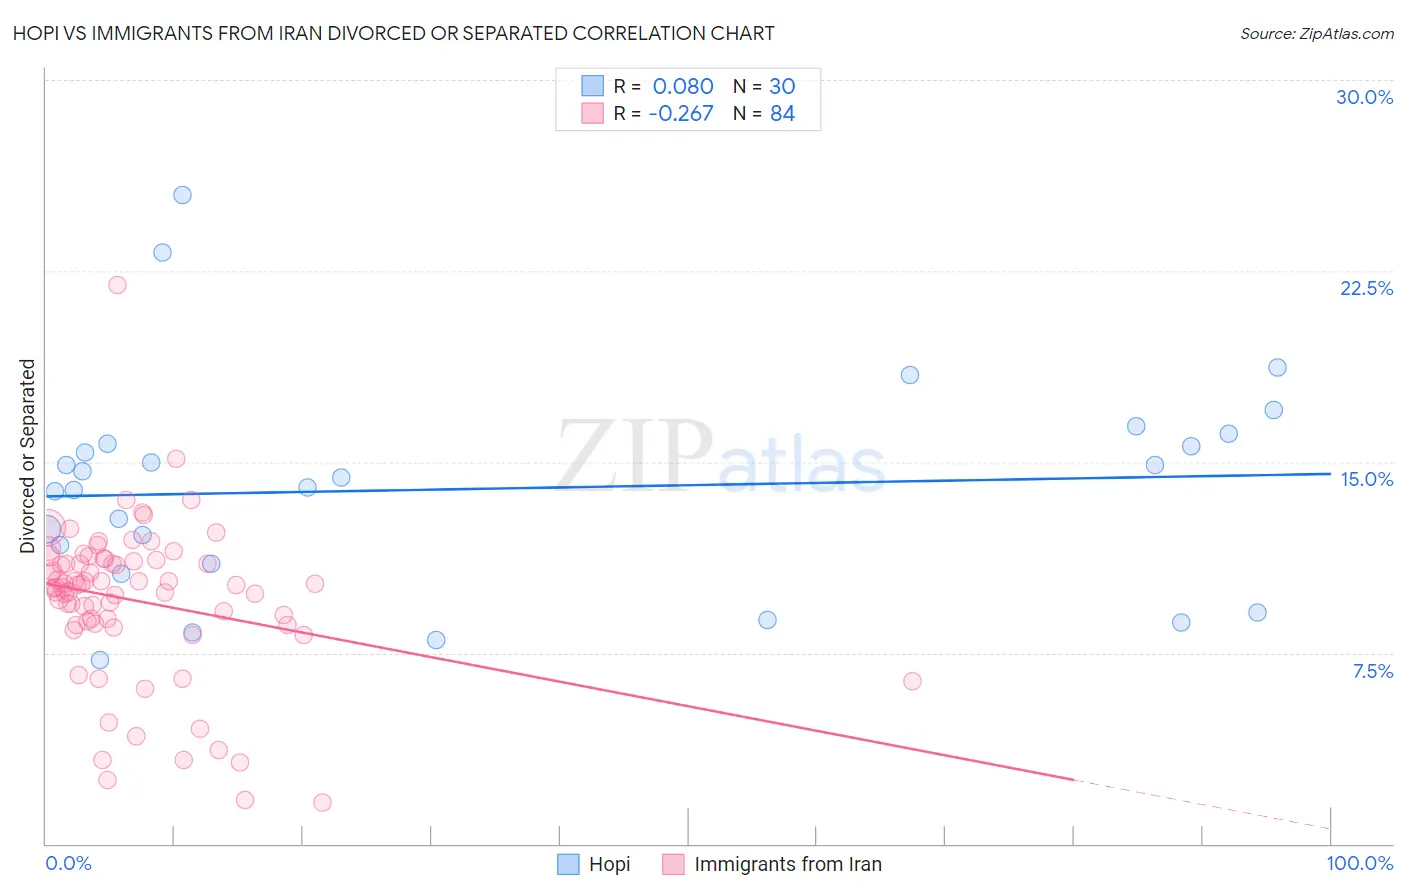
Hopi vs Immigrants from Iran Divorced or Separated Correlation Chart
The statistical analysis conducted on geographies consisting of 74,740,168 people shows a slight positive correlation between the proportion of Hopi and percentage of population currently divorced or separated in the United States with a correlation coefficient (R) of 0.080 and weighted average of 13.2%. Similarly, the statistical analysis conducted on geographies consisting of 279,868,346 people shows a weak negative correlation between the proportion of Immigrants from Iran and percentage of population currently divorced or separated in the United States with a correlation coefficient (R) of -0.267 and weighted average of 10.6%, a difference of 23.7%.
Divorced or Separated Correlation Summary
| Measurement | Hopi | Immigrants from Iran |
| Minimum | 7.2% | 1.6% |
| Maximum | 25.5% | 21.9% |
| Range | 18.3% | 20.3% |
| Mean | 13.9% | 9.5% |
| Median | 14.2% | 10.1% |
| Interquartile 25% (IQ1) | 11.0% | 8.6% |
| Interquartile 75% (IQ3) | 15.7% | 11.1% |
| Interquartile Range (IQR) | 4.7% | 2.5% |
| Standard Deviation (Sample) | 4.2% | 3.1% |
| Standard Deviation (Population) | 4.1% | 3.1% |
Similar Demographics by Divorced or Separated
Demographics Similar to Hopi by Divorced or Separated
In terms of divorced or separated, the demographic groups most similar to Hopi are Chippewa (13.2%, a difference of 0.050%), Cape Verdean (13.1%, a difference of 0.13%), Immigrants from Venezuela (13.1%, a difference of 0.15%), Tlingit-Haida (13.2%, a difference of 0.22%), and Alaskan Athabascan (13.1%, a difference of 0.25%).
| Demographics | Rating | Rank | Divorced or Separated |
| Natives/Alaskans | 0.0 /100 | #297 | Tragic 13.0% |
| Venezuelans | 0.0 /100 | #298 | Tragic 13.0% |
| Immigrants | Jamaica | 0.0 /100 | #299 | Tragic 13.0% |
| Immigrants | Cabo Verde | 0.0 /100 | #300 | Tragic 13.1% |
| Alaskan Athabascans | 0.0 /100 | #301 | Tragic 13.1% |
| Immigrants | Venezuela | 0.0 /100 | #302 | Tragic 13.1% |
| Cape Verdeans | 0.0 /100 | #303 | Tragic 13.1% |
| Hopi | 0.0 /100 | #304 | Tragic 13.2% |
| Chippewa | 0.0 /100 | #305 | Tragic 13.2% |
| Tlingit-Haida | 0.0 /100 | #306 | Tragic 13.2% |
| French American Indians | 0.0 /100 | #307 | Tragic 13.2% |
| Ottawa | 0.0 /100 | #308 | Tragic 13.2% |
| Americans | 0.0 /100 | #309 | Tragic 13.2% |
| Africans | 0.0 /100 | #310 | Tragic 13.2% |
| Sioux | 0.0 /100 | #311 | Tragic 13.2% |
Demographics Similar to Immigrants from Iran by Divorced or Separated
In terms of divorced or separated, the demographic groups most similar to Immigrants from Iran are Asian (10.6%, a difference of 0.0%), Immigrants from Israel (10.6%, a difference of 0.090%), Immigrants from Korea (10.6%, a difference of 0.19%), Immigrants from Armenia (10.6%, a difference of 0.63%), and Assyrian/Chaldean/Syriac (10.6%, a difference of 0.70%).
| Demographics | Rating | Rank | Divorced or Separated |
| Immigrants | South Central Asia | 100.0 /100 | #11 | Exceptional 10.4% |
| Okinawans | 100.0 /100 | #12 | Exceptional 10.5% |
| Cypriots | 100.0 /100 | #13 | Exceptional 10.5% |
| Assyrians/Chaldeans/Syriacs | 100.0 /100 | #14 | Exceptional 10.6% |
| Immigrants | Armenia | 100.0 /100 | #15 | Exceptional 10.6% |
| Immigrants | Korea | 100.0 /100 | #16 | Exceptional 10.6% |
| Immigrants | Israel | 100.0 /100 | #17 | Exceptional 10.6% |
| Immigrants | Iran | 100.0 /100 | #18 | Exceptional 10.6% |
| Asians | 100.0 /100 | #19 | Exceptional 10.6% |
| Burmese | 100.0 /100 | #20 | Exceptional 10.7% |
| Immigrants | Asia | 100.0 /100 | #21 | Exceptional 10.7% |
| Vietnamese | 100.0 /100 | #22 | Exceptional 10.8% |
| Immigrants | Pakistan | 100.0 /100 | #23 | Exceptional 10.8% |
| Immigrants | Sri Lanka | 100.0 /100 | #24 | Exceptional 10.8% |
| Iranians | 100.0 /100 | #25 | Exceptional 10.8% |