Immigrants from Western Africa vs Yugoslavian Family Households
COMPARE
Immigrants from Western Africa
Yugoslavian
Family Households
Family Households Comparison
Immigrants from Western Africa
Yugoslavians
63.1%
FAMILY HOUSEHOLDS
0.5/ 100
METRIC RATING
266th/ 347
METRIC RANK
63.1%
FAMILY HOUSEHOLDS
0.4/ 100
METRIC RATING
269th/ 347
METRIC RANK
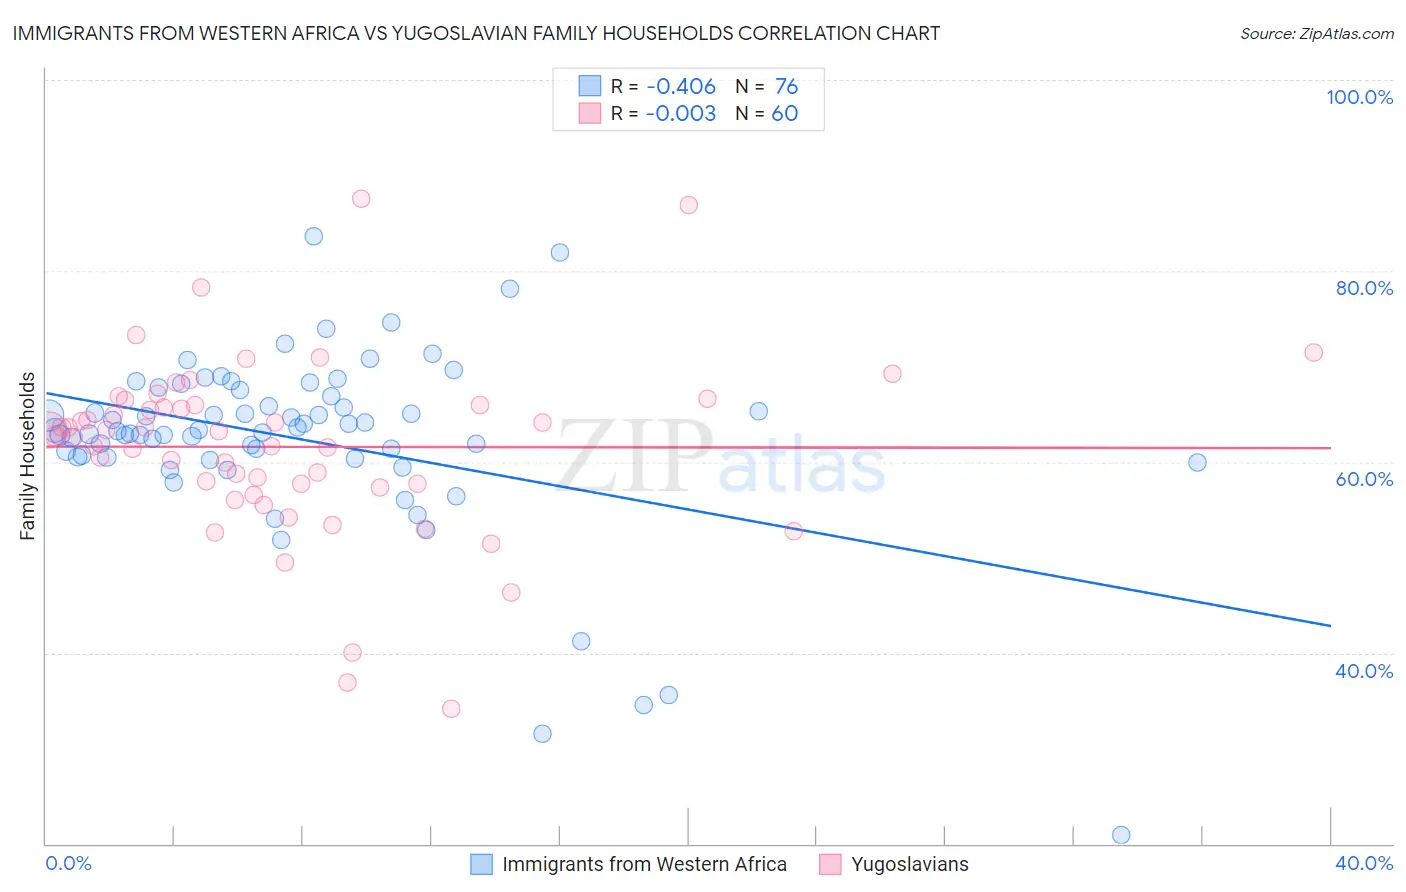
Immigrants from Western Africa vs Yugoslavian Family Households Correlation Chart
The statistical analysis conducted on geographies consisting of 357,554,747 people shows a moderate negative correlation between the proportion of Immigrants from Western Africa and percentage of family households in the United States with a correlation coefficient (R) of -0.406 and weighted average of 63.1%. Similarly, the statistical analysis conducted on geographies consisting of 285,640,029 people shows no correlation between the proportion of Yugoslavians and percentage of family households in the United States with a correlation coefficient (R) of -0.003 and weighted average of 63.1%, a difference of 0.10%.
Family Households Correlation Summary
| Measurement | Immigrants from Western Africa | Yugoslavian |
| Minimum | 20.9% | 34.1% |
| Maximum | 83.6% | 87.5% |
| Range | 62.7% | 53.4% |
| Mean | 62.4% | 61.6% |
| Median | 63.3% | 62.9% |
| Interquartile 25% (IQ1) | 60.5% | 57.5% |
| Interquartile 75% (IQ3) | 67.2% | 65.9% |
| Interquartile Range (IQR) | 6.7% | 8.5% |
| Standard Deviation (Sample) | 9.9% | 9.4% |
| Standard Deviation (Population) | 9.8% | 9.4% |
Demographics Similar to Immigrants from Western Africa and Yugoslavians by Family Households
In terms of family households, the demographic groups most similar to Immigrants from Western Africa are Colville (63.2%, a difference of 0.010%), Cheyenne (63.2%, a difference of 0.020%), Kenyan (63.2%, a difference of 0.020%), Israeli (63.1%, a difference of 0.040%), and Immigrants from Ireland (63.2%, a difference of 0.050%). Similarly, the demographic groups most similar to Yugoslavians are Immigrants from Singapore (63.1%, a difference of 0.0%), Immigrants from Austria (63.1%, a difference of 0.020%), Immigrants from Croatia (63.1%, a difference of 0.030%), Immigrants from Turkey (63.1%, a difference of 0.030%), and Immigrants from Kazakhstan (63.1%, a difference of 0.040%).
| Demographics | Rating | Rank | Family Households |
| Icelanders | 0.8 /100 | #257 | Tragic 63.3% |
| Immigrants | Barbados | 0.7 /100 | #258 | Tragic 63.2% |
| Immigrants | Western Europe | 0.6 /100 | #259 | Tragic 63.2% |
| Cypriots | 0.6 /100 | #260 | Tragic 63.2% |
| Immigrants | Russia | 0.6 /100 | #261 | Tragic 63.2% |
| Immigrants | Ireland | 0.6 /100 | #262 | Tragic 63.2% |
| Cheyenne | 0.5 /100 | #263 | Tragic 63.2% |
| Kenyans | 0.5 /100 | #264 | Tragic 63.2% |
| Colville | 0.5 /100 | #265 | Tragic 63.2% |
| Immigrants | Western Africa | 0.5 /100 | #266 | Tragic 63.1% |
| Israelis | 0.4 /100 | #267 | Tragic 63.1% |
| Immigrants | Singapore | 0.4 /100 | #268 | Tragic 63.1% |
| Yugoslavians | 0.4 /100 | #269 | Tragic 63.1% |
| Immigrants | Austria | 0.3 /100 | #270 | Tragic 63.1% |
| Immigrants | Croatia | 0.3 /100 | #271 | Tragic 63.1% |
| Immigrants | Turkey | 0.3 /100 | #272 | Tragic 63.1% |
| Immigrants | Kazakhstan | 0.3 /100 | #273 | Tragic 63.1% |
| Lumbee | 0.3 /100 | #274 | Tragic 63.1% |
| West Indians | 0.3 /100 | #275 | Tragic 63.1% |
| Serbians | 0.3 /100 | #276 | Tragic 63.0% |
| Ottawa | 0.3 /100 | #277 | Tragic 63.0% |