Immigrants from Uzbekistan vs Venezuelan Currently Married
COMPARE
Immigrants from Uzbekistan
Venezuelan
Currently Married
Currently Married Comparison
Immigrants from Uzbekistan
Venezuelans
46.9%
CURRENTLY MARRIED
66.0/ 100
METRIC RATING
160th/ 347
METRIC RANK
47.1%
CURRENTLY MARRIED
74.4/ 100
METRIC RATING
141st/ 347
METRIC RANK
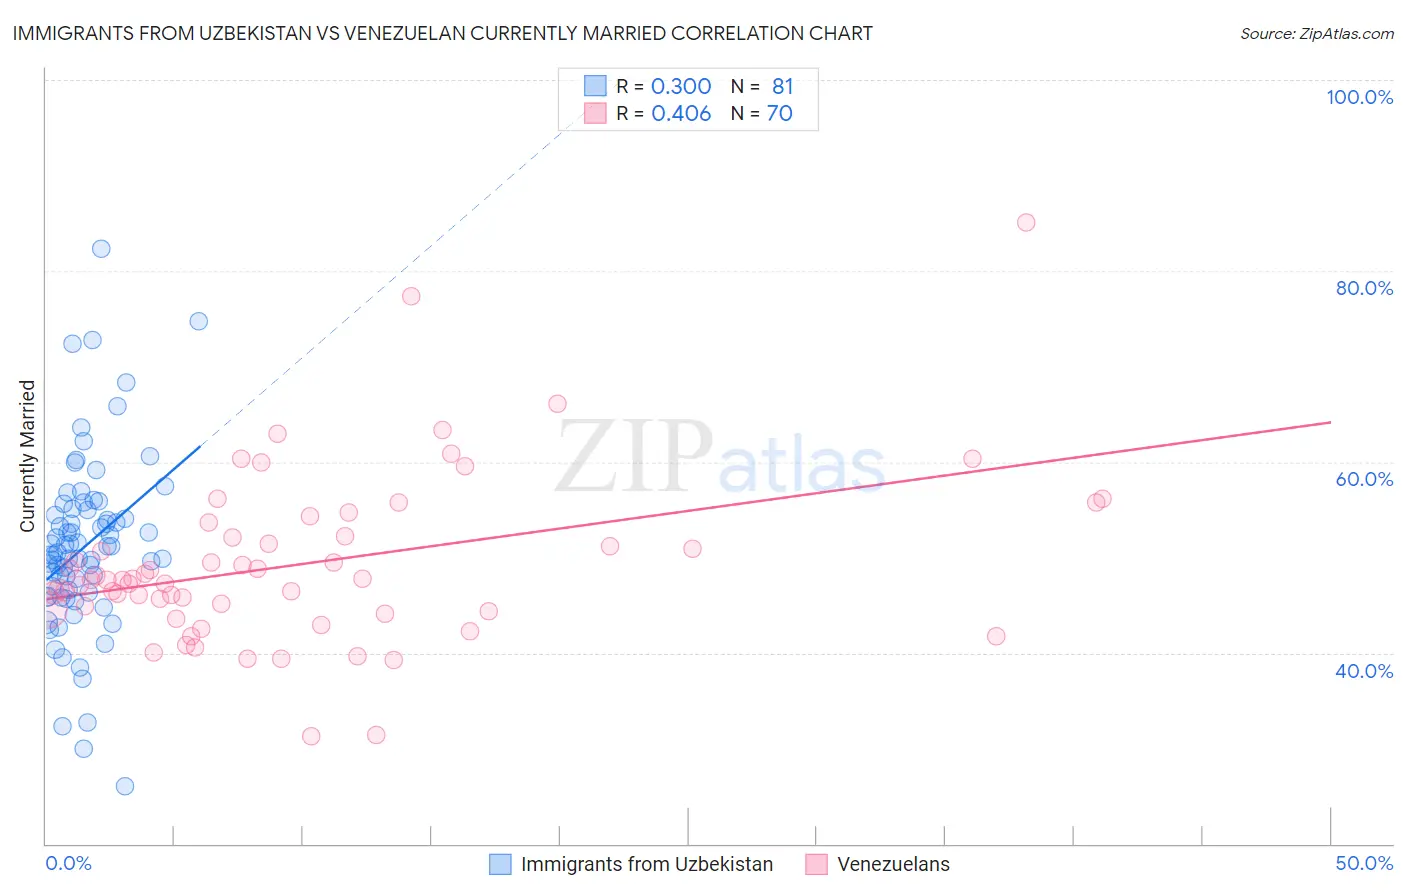
Immigrants from Uzbekistan vs Venezuelan Currently Married Correlation Chart
The statistical analysis conducted on geographies consisting of 118,761,741 people shows a mild positive correlation between the proportion of Immigrants from Uzbekistan and percentage of population currently married in the United States with a correlation coefficient (R) of 0.300 and weighted average of 46.9%. Similarly, the statistical analysis conducted on geographies consisting of 306,286,005 people shows a moderate positive correlation between the proportion of Venezuelans and percentage of population currently married in the United States with a correlation coefficient (R) of 0.406 and weighted average of 47.1%, a difference of 0.37%.
Currently Married Correlation Summary
| Measurement | Immigrants from Uzbekistan | Venezuelan |
| Minimum | 26.0% | 31.2% |
| Maximum | 82.3% | 85.1% |
| Range | 56.3% | 53.9% |
| Mean | 51.1% | 49.3% |
| Median | 50.5% | 47.6% |
| Interquartile 25% (IQ1) | 46.1% | 44.5% |
| Interquartile 75% (IQ3) | 55.0% | 52.2% |
| Interquartile Range (IQR) | 8.9% | 7.7% |
| Standard Deviation (Sample) | 9.3% | 8.8% |
| Standard Deviation (Population) | 9.3% | 8.8% |
Demographics Similar to Immigrants from Uzbekistan and Venezuelans by Currently Married
In terms of currently married, the demographic groups most similar to Immigrants from Uzbekistan are Iraqi (46.9%, a difference of 0.020%), Cherokee (46.9%, a difference of 0.030%), Immigrants from Switzerland (46.9%, a difference of 0.080%), Spanish (47.0%, a difference of 0.090%), and Immigrants from Venezuela (47.0%, a difference of 0.11%). Similarly, the demographic groups most similar to Venezuelans are Argentinean (47.1%, a difference of 0.0%), Guamanian/Chamorro (47.1%, a difference of 0.010%), Cajun (47.1%, a difference of 0.040%), Hmong (47.1%, a difference of 0.050%), and Immigrants from South Eastern Asia (47.1%, a difference of 0.070%).
| Demographics | Rating | Rank | Currently Married |
| Cajuns | 75.3 /100 | #140 | Good 47.1% |
| Venezuelans | 74.4 /100 | #141 | Good 47.1% |
| Argentineans | 74.4 /100 | #142 | Good 47.1% |
| Guamanians/Chamorros | 74.2 /100 | #143 | Good 47.1% |
| Hmong | 73.4 /100 | #144 | Good 47.1% |
| Immigrants | South Eastern Asia | 72.9 /100 | #145 | Good 47.1% |
| Carpatho Rusyns | 72.6 /100 | #146 | Good 47.0% |
| Immigrants | Argentina | 72.0 /100 | #147 | Good 47.0% |
| Cambodians | 70.4 /100 | #148 | Good 47.0% |
| Zimbabweans | 70.1 /100 | #149 | Good 47.0% |
| Immigrants | Turkey | 70.0 /100 | #150 | Good 47.0% |
| Chileans | 69.8 /100 | #151 | Good 47.0% |
| Immigrants | Serbia | 68.8 /100 | #152 | Good 47.0% |
| Immigrants | Venezuela | 68.6 /100 | #153 | Good 47.0% |
| Albanians | 68.6 /100 | #154 | Good 47.0% |
| Arabs | 68.6 /100 | #155 | Good 47.0% |
| Spanish | 68.1 /100 | #156 | Good 47.0% |
| Immigrants | Switzerland | 67.8 /100 | #157 | Good 46.9% |
| Cherokee | 66.8 /100 | #158 | Good 46.9% |
| Iraqis | 66.4 /100 | #159 | Good 46.9% |
| Immigrants | Uzbekistan | 66.0 /100 | #160 | Good 46.9% |