Hawaiian vs Delaware Married-couple Households
COMPARE
Hawaiian
Delaware
Married-couple Households
Married-couple Households Comparison
Hawaiians
Delaware
47.8%
MARRIED-COUPLE HOUSEHOLDS
96.0/ 100
METRIC RATING
103rd/ 347
METRIC RANK
46.8%
MARRIED-COUPLE HOUSEHOLDS
71.2/ 100
METRIC RATING
161st/ 347
METRIC RANK
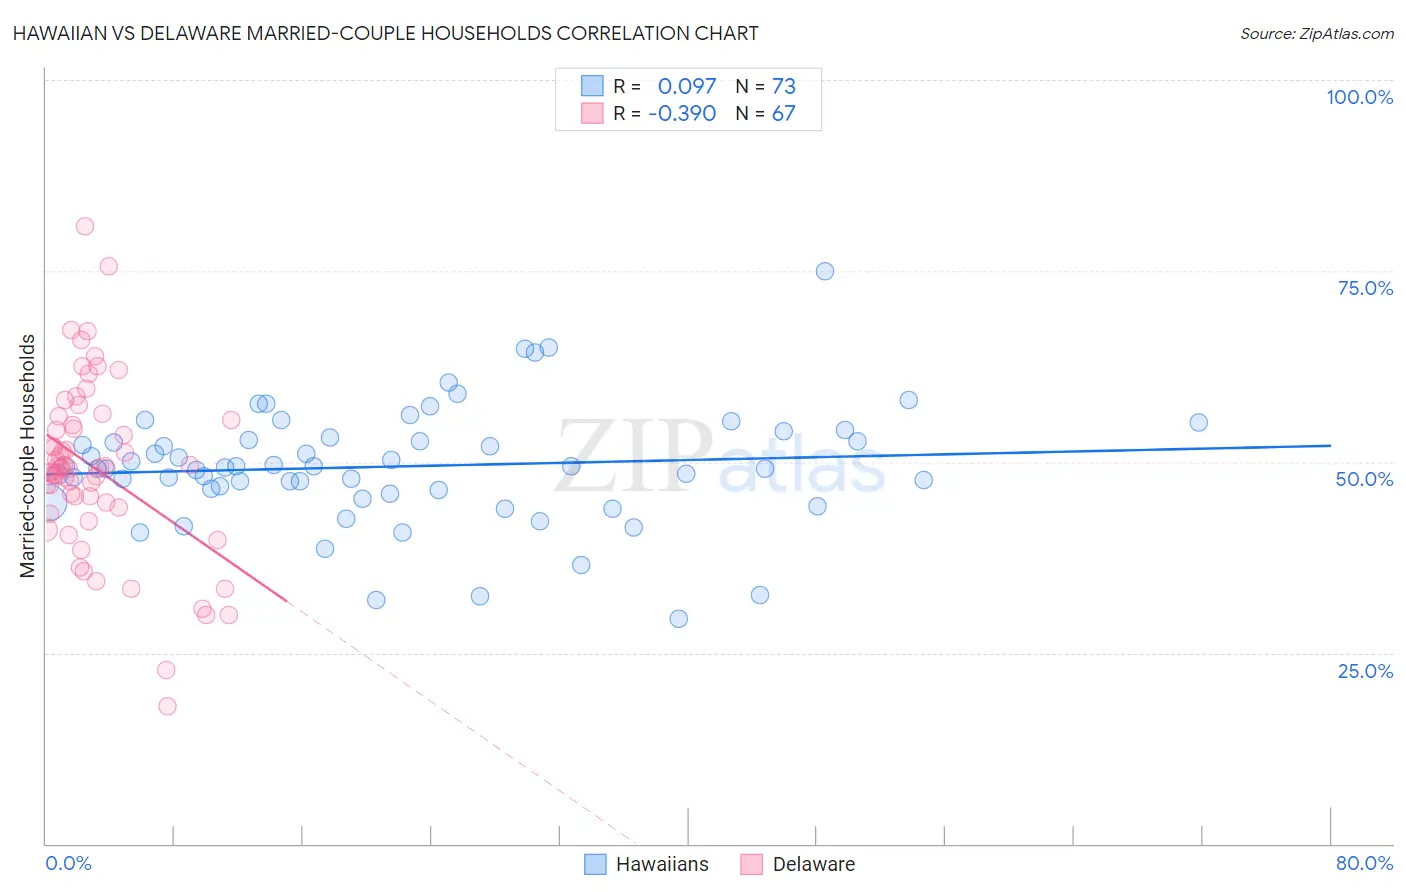
Hawaiian vs Delaware Married-couple Households Correlation Chart
The statistical analysis conducted on geographies consisting of 327,384,536 people shows a slight positive correlation between the proportion of Hawaiians and percentage of married-couple family households in the United States with a correlation coefficient (R) of 0.097 and weighted average of 47.8%. Similarly, the statistical analysis conducted on geographies consisting of 96,227,266 people shows a mild negative correlation between the proportion of Delaware and percentage of married-couple family households in the United States with a correlation coefficient (R) of -0.390 and weighted average of 46.8%, a difference of 2.1%.
Married-couple Households Correlation Summary
| Measurement | Hawaiian | Delaware |
| Minimum | 29.5% | 18.0% |
| Maximum | 75.0% | 80.9% |
| Range | 45.5% | 62.9% |
| Mean | 49.4% | 49.2% |
| Median | 49.3% | 49.3% |
| Interquartile 25% (IQ1) | 46.0% | 44.0% |
| Interquartile 75% (IQ3) | 53.0% | 55.4% |
| Interquartile Range (IQR) | 7.0% | 11.4% |
| Standard Deviation (Sample) | 7.7% | 11.3% |
| Standard Deviation (Population) | 7.7% | 11.3% |
Similar Demographics by Married-couple Households
Demographics Similar to Hawaiians by Married-couple Households
In terms of married-couple households, the demographic groups most similar to Hawaiians are Slavic (47.8%, a difference of 0.0%), Immigrants from South Africa (47.8%, a difference of 0.010%), Turkish (47.8%, a difference of 0.020%), Immigrants from Italy (47.9%, a difference of 0.080%), and Immigrants from Austria (47.9%, a difference of 0.090%).
| Demographics | Rating | Rank | Married-couple Households |
| Immigrants | Egypt | 96.6 /100 | #96 | Exceptional 47.9% |
| Latvians | 96.5 /100 | #97 | Exceptional 47.9% |
| Immigrants | North Macedonia | 96.4 /100 | #98 | Exceptional 47.9% |
| Immigrants | Austria | 96.4 /100 | #99 | Exceptional 47.9% |
| Immigrants | Italy | 96.3 /100 | #100 | Exceptional 47.9% |
| Turks | 96.1 /100 | #101 | Exceptional 47.8% |
| Slavs | 96.0 /100 | #102 | Exceptional 47.8% |
| Hawaiians | 96.0 /100 | #103 | Exceptional 47.8% |
| Immigrants | South Africa | 96.0 /100 | #104 | Exceptional 47.8% |
| Immigrants | Czechoslovakia | 95.5 /100 | #105 | Exceptional 47.8% |
| Portuguese | 95.5 /100 | #106 | Exceptional 47.8% |
| Estonians | 94.7 /100 | #107 | Exceptional 47.7% |
| Immigrants | Japan | 94.4 /100 | #108 | Exceptional 47.7% |
| Immigrants | Jordan | 94.1 /100 | #109 | Exceptional 47.7% |
| Macedonians | 93.9 /100 | #110 | Exceptional 47.6% |
Demographics Similar to Delaware by Married-couple Households
In terms of married-couple households, the demographic groups most similar to Delaware are Colombian (46.8%, a difference of 0.010%), Iraqi (46.9%, a difference of 0.020%), Immigrants from Turkey (46.8%, a difference of 0.040%), Immigrants from Kazakhstan (46.8%, a difference of 0.060%), and Immigrants from Southern Europe (46.8%, a difference of 0.060%).
| Demographics | Rating | Rank | Married-couple Households |
| Immigrants | Western Asia | 76.1 /100 | #154 | Good 46.9% |
| Arabs | 76.0 /100 | #155 | Good 46.9% |
| Armenians | 75.4 /100 | #156 | Good 46.9% |
| Immigrants | Oceania | 74.8 /100 | #157 | Good 46.9% |
| Immigrants | Nonimmigrants | 73.3 /100 | #158 | Good 46.9% |
| Osage | 73.2 /100 | #159 | Good 46.9% |
| Iraqis | 71.7 /100 | #160 | Good 46.9% |
| Delaware | 71.2 /100 | #161 | Good 46.8% |
| Colombians | 71.0 /100 | #162 | Good 46.8% |
| Immigrants | Turkey | 70.2 /100 | #163 | Good 46.8% |
| Immigrants | Kazakhstan | 70.0 /100 | #164 | Good 46.8% |
| Immigrants | Southern Europe | 69.9 /100 | #165 | Good 46.8% |
| Cherokee | 65.7 /100 | #166 | Good 46.7% |
| Immigrants | Croatia | 64.2 /100 | #167 | Good 46.7% |
| Israelis | 62.3 /100 | #168 | Good 46.7% |