Hawaiian vs Chippewa Married-couple Households
COMPARE
Hawaiian
Chippewa
Married-couple Households
Married-couple Households Comparison
Hawaiians
Chippewa
47.8%
MARRIED-COUPLE HOUSEHOLDS
96.0/ 100
METRIC RATING
103rd/ 347
METRIC RANK
42.1%
MARRIED-COUPLE HOUSEHOLDS
0.0/ 100
METRIC RATING
287th/ 347
METRIC RANK
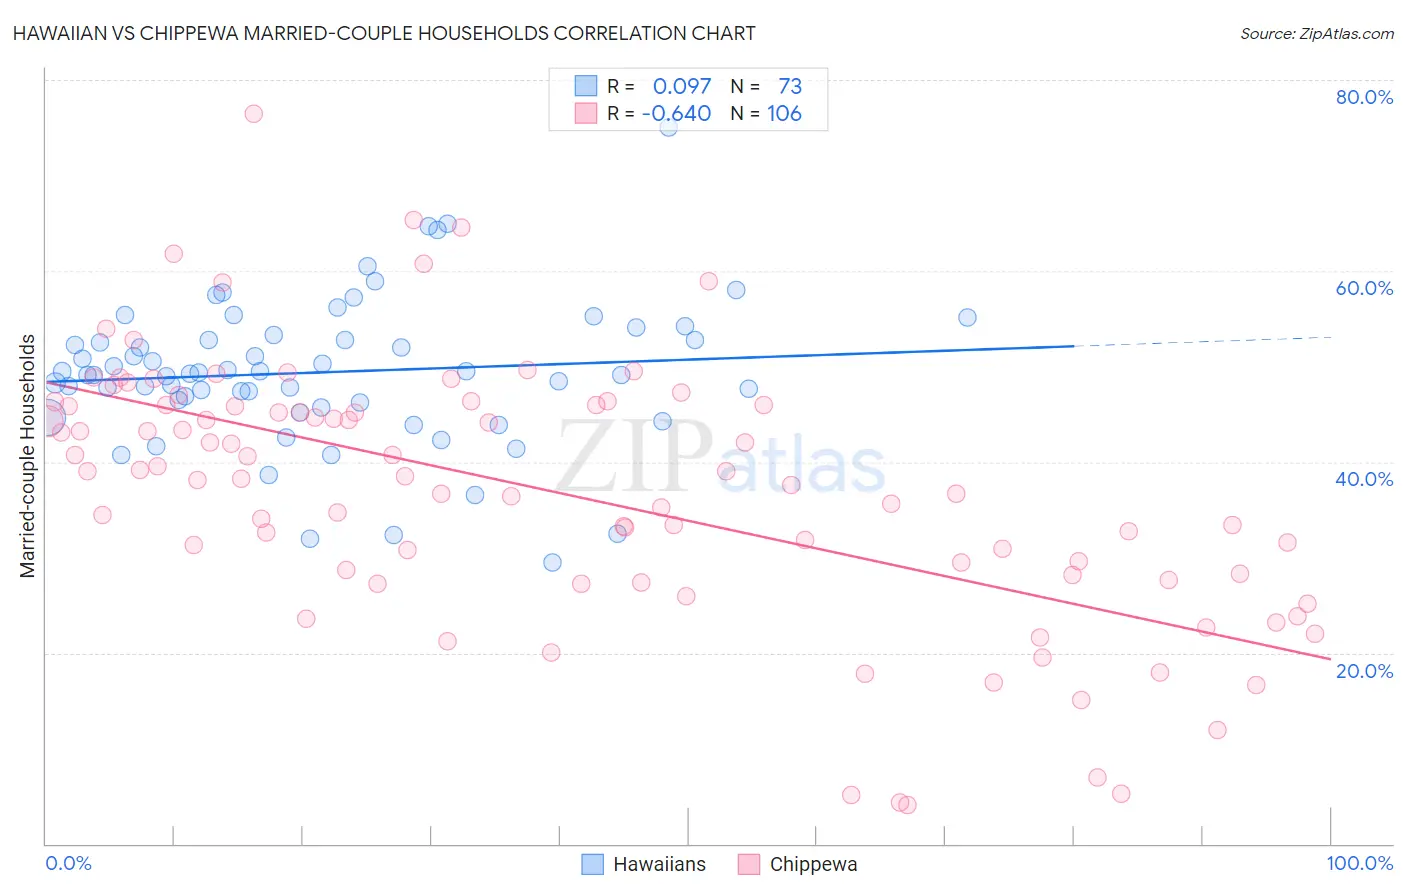
Hawaiian vs Chippewa Married-couple Households Correlation Chart
The statistical analysis conducted on geographies consisting of 327,384,536 people shows a slight positive correlation between the proportion of Hawaiians and percentage of married-couple family households in the United States with a correlation coefficient (R) of 0.097 and weighted average of 47.8%. Similarly, the statistical analysis conducted on geographies consisting of 214,993,605 people shows a significant negative correlation between the proportion of Chippewa and percentage of married-couple family households in the United States with a correlation coefficient (R) of -0.640 and weighted average of 42.1%, a difference of 13.5%.
Married-couple Households Correlation Summary
| Measurement | Hawaiian | Chippewa |
| Minimum | 29.5% | 4.0% |
| Maximum | 75.0% | 76.5% |
| Range | 45.5% | 72.5% |
| Mean | 49.4% | 36.8% |
| Median | 49.3% | 38.4% |
| Interquartile 25% (IQ1) | 46.0% | 28.2% |
| Interquartile 75% (IQ3) | 53.0% | 45.9% |
| Interquartile Range (IQR) | 7.0% | 17.7% |
| Standard Deviation (Sample) | 7.7% | 13.8% |
| Standard Deviation (Population) | 7.7% | 13.7% |
Similar Demographics by Married-couple Households
Demographics Similar to Hawaiians by Married-couple Households
In terms of married-couple households, the demographic groups most similar to Hawaiians are Slavic (47.8%, a difference of 0.0%), Immigrants from South Africa (47.8%, a difference of 0.010%), Turkish (47.8%, a difference of 0.020%), Immigrants from Italy (47.9%, a difference of 0.080%), and Immigrants from Austria (47.9%, a difference of 0.090%).
| Demographics | Rating | Rank | Married-couple Households |
| Immigrants | Egypt | 96.6 /100 | #96 | Exceptional 47.9% |
| Latvians | 96.5 /100 | #97 | Exceptional 47.9% |
| Immigrants | North Macedonia | 96.4 /100 | #98 | Exceptional 47.9% |
| Immigrants | Austria | 96.4 /100 | #99 | Exceptional 47.9% |
| Immigrants | Italy | 96.3 /100 | #100 | Exceptional 47.9% |
| Turks | 96.1 /100 | #101 | Exceptional 47.8% |
| Slavs | 96.0 /100 | #102 | Exceptional 47.8% |
| Hawaiians | 96.0 /100 | #103 | Exceptional 47.8% |
| Immigrants | South Africa | 96.0 /100 | #104 | Exceptional 47.8% |
| Immigrants | Czechoslovakia | 95.5 /100 | #105 | Exceptional 47.8% |
| Portuguese | 95.5 /100 | #106 | Exceptional 47.8% |
| Estonians | 94.7 /100 | #107 | Exceptional 47.7% |
| Immigrants | Japan | 94.4 /100 | #108 | Exceptional 47.7% |
| Immigrants | Jordan | 94.1 /100 | #109 | Exceptional 47.7% |
| Macedonians | 93.9 /100 | #110 | Exceptional 47.6% |
Demographics Similar to Chippewa by Married-couple Households
In terms of married-couple households, the demographic groups most similar to Chippewa are Immigrants from Eritrea (42.1%, a difference of 0.080%), Sudanese (42.1%, a difference of 0.14%), Honduran (42.1%, a difference of 0.19%), Paiute (42.1%, a difference of 0.20%), and Belizean (42.2%, a difference of 0.24%).
| Demographics | Rating | Rank | Married-couple Households |
| Immigrants | Ecuador | 0.0 /100 | #280 | Tragic 42.9% |
| Immigrants | Guatemala | 0.0 /100 | #281 | Tragic 42.8% |
| Bermudans | 0.0 /100 | #282 | Tragic 42.4% |
| Inupiat | 0.0 /100 | #283 | Tragic 42.4% |
| Cheyenne | 0.0 /100 | #284 | Tragic 42.3% |
| Ghanaians | 0.0 /100 | #285 | Tragic 42.2% |
| Belizeans | 0.0 /100 | #286 | Tragic 42.2% |
| Chippewa | 0.0 /100 | #287 | Tragic 42.1% |
| Immigrants | Eritrea | 0.0 /100 | #288 | Tragic 42.1% |
| Sudanese | 0.0 /100 | #289 | Tragic 42.1% |
| Hondurans | 0.0 /100 | #290 | Tragic 42.1% |
| Paiute | 0.0 /100 | #291 | Tragic 42.1% |
| Indonesians | 0.0 /100 | #292 | Tragic 42.0% |
| Menominee | 0.0 /100 | #293 | Tragic 42.0% |
| Immigrants | Yemen | 0.0 /100 | #294 | Tragic 42.0% |