Delaware vs Assyrian/Chaldean/Syriac Currently Married
COMPARE
Delaware
Assyrian/Chaldean/Syriac
Currently Married
Currently Married Comparison
Delaware
Assyrians/Chaldeans/Syriacs
46.9%
CURRENTLY MARRIED
64.7/ 100
METRIC RATING
163rd/ 347
METRIC RANK
50.8%
CURRENTLY MARRIED
100.0/ 100
METRIC RATING
3rd/ 347
METRIC RANK
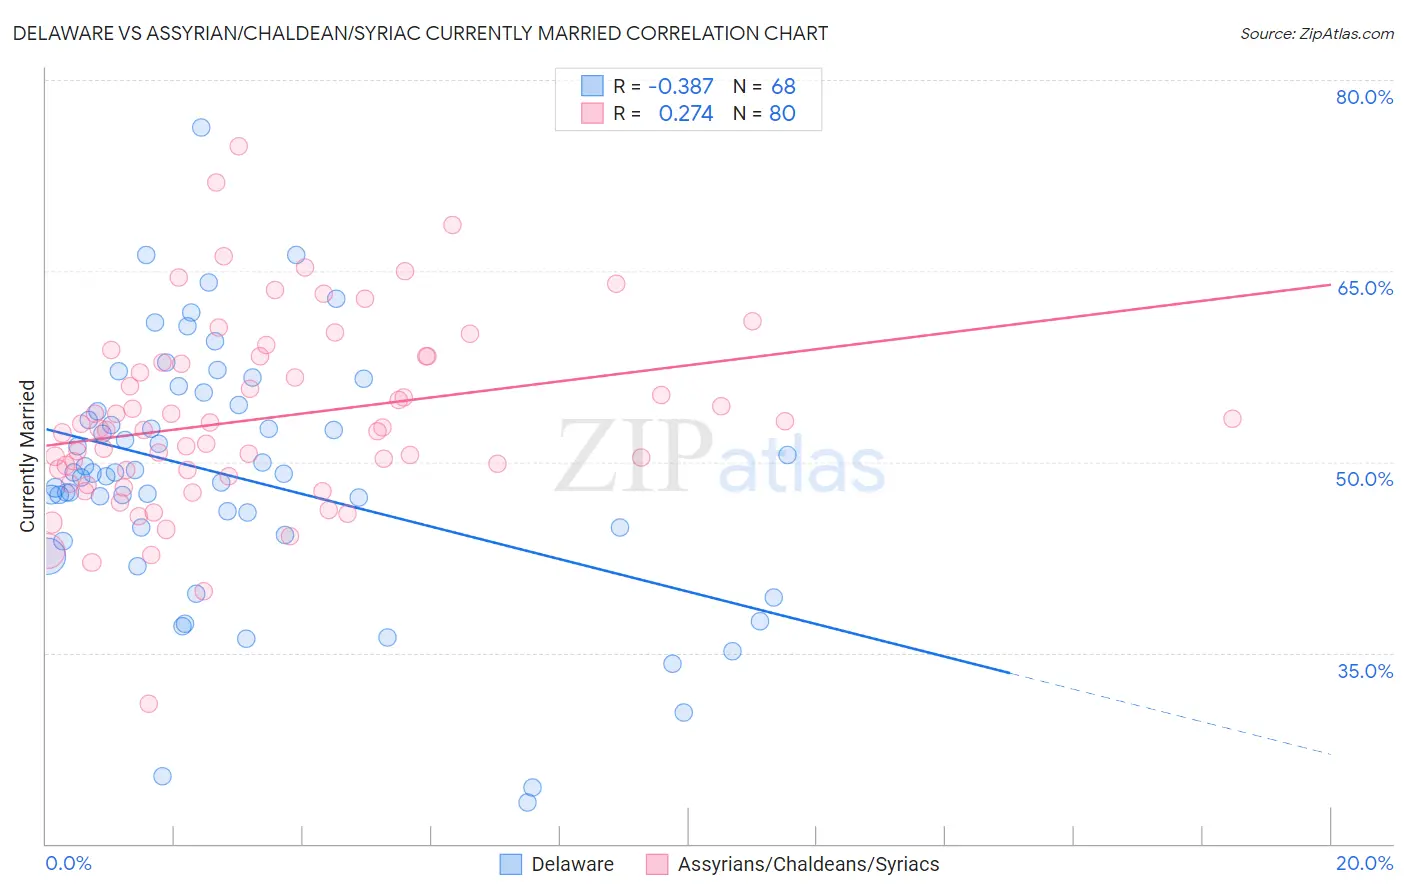
Delaware vs Assyrian/Chaldean/Syriac Currently Married Correlation Chart
The statistical analysis conducted on geographies consisting of 96,237,198 people shows a mild negative correlation between the proportion of Delaware and percentage of population currently married in the United States with a correlation coefficient (R) of -0.387 and weighted average of 46.9%. Similarly, the statistical analysis conducted on geographies consisting of 110,318,125 people shows a weak positive correlation between the proportion of Assyrians/Chaldeans/Syriacs and percentage of population currently married in the United States with a correlation coefficient (R) of 0.274 and weighted average of 50.8%, a difference of 8.3%.
Currently Married Correlation Summary
| Measurement | Delaware | Assyrian/Chaldean/Syriac |
| Minimum | 23.2% | 31.0% |
| Maximum | 76.3% | 74.8% |
| Range | 53.1% | 43.8% |
| Mean | 48.7% | 53.4% |
| Median | 49.1% | 52.6% |
| Interquartile 25% (IQ1) | 44.5% | 49.1% |
| Interquartile 75% (IQ3) | 54.2% | 58.1% |
| Interquartile Range (IQR) | 9.7% | 8.9% |
| Standard Deviation (Sample) | 9.9% | 7.4% |
| Standard Deviation (Population) | 9.9% | 7.3% |
Similar Demographics by Currently Married
Demographics Similar to Delaware by Currently Married
In terms of currently married, the demographic groups most similar to Delaware are Immigrants from Western Asia (46.9%, a difference of 0.020%), Nonimmigrants (46.9%, a difference of 0.030%), Immigrants from Uzbekistan (46.9%, a difference of 0.050%), Immigrants from Southern Europe (46.9%, a difference of 0.050%), and Iraqi (46.9%, a difference of 0.070%).
| Demographics | Rating | Rank | Currently Married |
| Spanish | 68.1 /100 | #156 | Good 47.0% |
| Immigrants | Switzerland | 67.8 /100 | #157 | Good 46.9% |
| Cherokee | 66.8 /100 | #158 | Good 46.9% |
| Iraqis | 66.4 /100 | #159 | Good 46.9% |
| Immigrants | Uzbekistan | 66.0 /100 | #160 | Good 46.9% |
| Immigrants | Southern Europe | 65.9 /100 | #161 | Good 46.9% |
| Immigrants | Nonimmigrants | 65.4 /100 | #162 | Good 46.9% |
| Delaware | 64.7 /100 | #163 | Good 46.9% |
| Immigrants | Western Asia | 64.2 /100 | #164 | Good 46.9% |
| Samoans | 59.8 /100 | #165 | Average 46.8% |
| Immigrants | Syria | 59.3 /100 | #166 | Average 46.8% |
| Spaniards | 58.8 /100 | #167 | Average 46.8% |
| Immigrants | Afghanistan | 58.2 /100 | #168 | Average 46.8% |
| Armenians | 58.2 /100 | #169 | Average 46.8% |
| Immigrants | Latvia | 56.7 /100 | #170 | Average 46.7% |
Demographics Similar to Assyrians/Chaldeans/Syriacs by Currently Married
In terms of currently married, the demographic groups most similar to Assyrians/Chaldeans/Syriacs are Immigrants from Taiwan (50.7%, a difference of 0.080%), Thai (50.9%, a difference of 0.18%), Danish (50.5%, a difference of 0.63%), Norwegian (50.2%, a difference of 1.2%), and Immigrants from South Central Asia (50.0%, a difference of 1.5%).
| Demographics | Rating | Rank | Currently Married |
| Immigrants | India | 100.0 /100 | #1 | Exceptional 51.8% |
| Thais | 100.0 /100 | #2 | Exceptional 50.9% |
| Assyrians/Chaldeans/Syriacs | 100.0 /100 | #3 | Exceptional 50.8% |
| Immigrants | Taiwan | 100.0 /100 | #4 | Exceptional 50.7% |
| Danes | 100.0 /100 | #5 | Exceptional 50.5% |
| Norwegians | 100.0 /100 | #6 | Exceptional 50.2% |
| Immigrants | South Central Asia | 100.0 /100 | #7 | Exceptional 50.0% |
| Swedes | 100.0 /100 | #8 | Exceptional 50.0% |
| Czechs | 99.9 /100 | #9 | Exceptional 49.9% |
| Filipinos | 99.9 /100 | #10 | Exceptional 49.7% |
| English | 99.9 /100 | #11 | Exceptional 49.7% |
| Swiss | 99.9 /100 | #12 | Exceptional 49.7% |
| Dutch | 99.9 /100 | #13 | Exceptional 49.6% |
| Germans | 99.9 /100 | #14 | Exceptional 49.6% |
| Pennsylvania Germans | 99.9 /100 | #15 | Exceptional 49.6% |