Haitian vs Spanish American Indian Bachelor's Degree
COMPARE
Haitian
Spanish American Indian
Bachelor's Degree
Bachelor's Degree Comparison
Haitians
Spanish American Indians
31.3%
BACHELOR'S DEGREE
0.1/ 100
METRIC RATING
284th/ 347
METRIC RANK
27.5%
BACHELOR'S DEGREE
0.0/ 100
METRIC RATING
330th/ 347
METRIC RANK
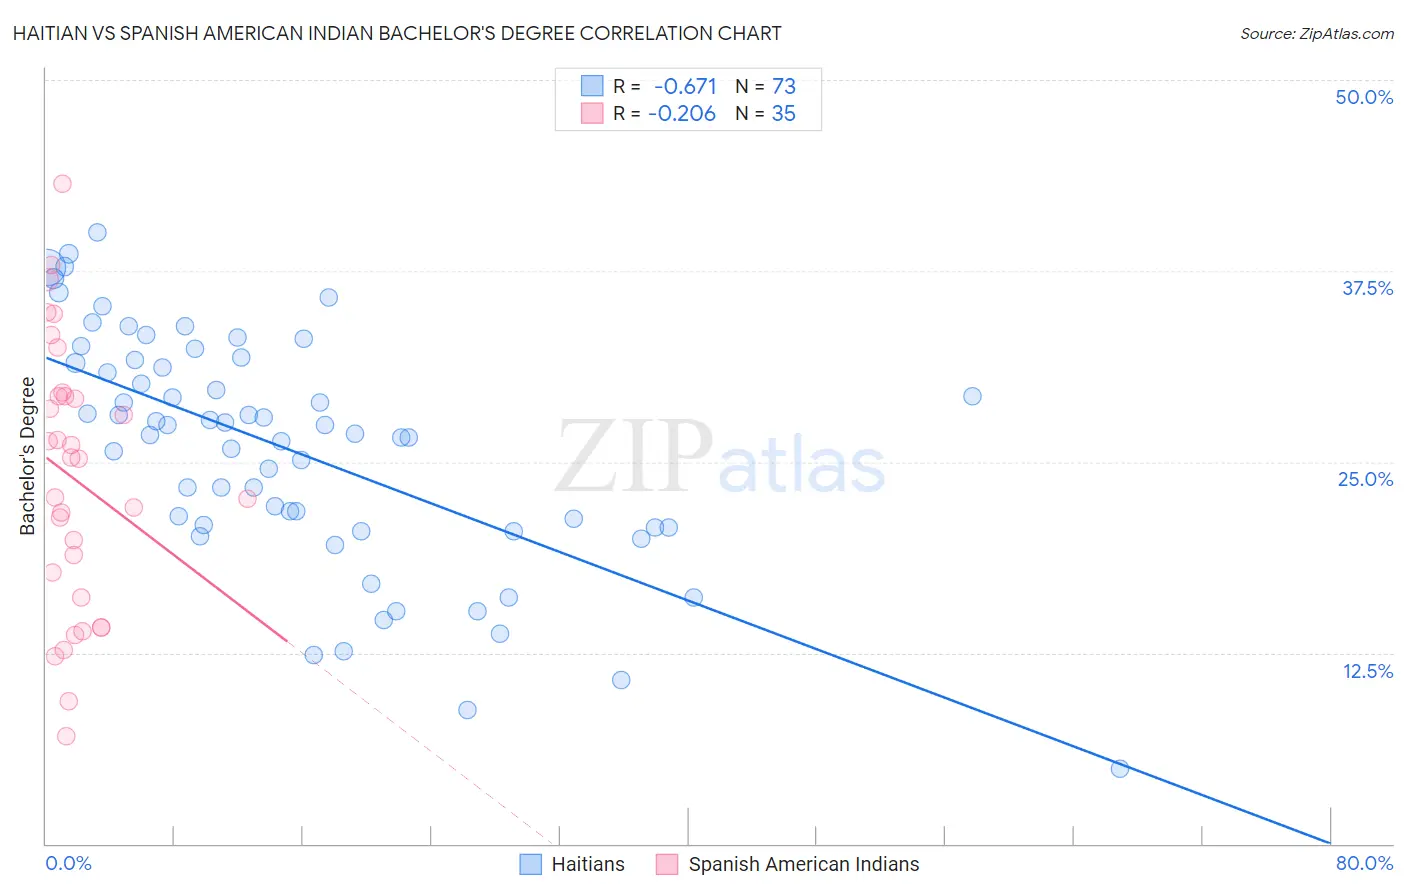
Haitian vs Spanish American Indian Bachelor's Degree Correlation Chart
The statistical analysis conducted on geographies consisting of 287,970,705 people shows a significant negative correlation between the proportion of Haitians and percentage of population with at least bachelor's degree education in the United States with a correlation coefficient (R) of -0.671 and weighted average of 31.3%. Similarly, the statistical analysis conducted on geographies consisting of 73,150,359 people shows a weak negative correlation between the proportion of Spanish American Indians and percentage of population with at least bachelor's degree education in the United States with a correlation coefficient (R) of -0.206 and weighted average of 27.5%, a difference of 14.1%.
Bachelor's Degree Correlation Summary
| Measurement | Haitian | Spanish American Indian |
| Minimum | 4.9% | 7.0% |
| Maximum | 40.1% | 43.2% |
| Range | 35.1% | 36.2% |
| Mean | 25.8% | 23.9% |
| Median | 26.9% | 25.2% |
| Interquartile 25% (IQ1) | 20.7% | 16.1% |
| Interquartile 75% (IQ3) | 31.6% | 29.3% |
| Interquartile Range (IQR) | 10.8% | 13.3% |
| Standard Deviation (Sample) | 7.6% | 8.8% |
| Standard Deviation (Population) | 7.6% | 8.7% |
Similar Demographics by Bachelor's Degree
Demographics Similar to Haitians by Bachelor's Degree
In terms of bachelor's degree, the demographic groups most similar to Haitians are Aleut (31.3%, a difference of 0.010%), Honduran (31.3%, a difference of 0.030%), Immigrants from El Salvador (31.3%, a difference of 0.070%), Immigrants from Caribbean (31.4%, a difference of 0.31%), and Blackfeet (31.5%, a difference of 0.45%).
| Demographics | Rating | Rank | Bachelor's Degree |
| Dominicans | 0.1 /100 | #277 | Tragic 31.8% |
| Marshallese | 0.1 /100 | #278 | Tragic 31.7% |
| Hawaiians | 0.1 /100 | #279 | Tragic 31.6% |
| Immigrants | Laos | 0.1 /100 | #280 | Tragic 31.6% |
| Blackfeet | 0.1 /100 | #281 | Tragic 31.5% |
| Immigrants | Caribbean | 0.1 /100 | #282 | Tragic 31.4% |
| Hondurans | 0.1 /100 | #283 | Tragic 31.3% |
| Haitians | 0.1 /100 | #284 | Tragic 31.3% |
| Aleuts | 0.1 /100 | #285 | Tragic 31.3% |
| Immigrants | El Salvador | 0.1 /100 | #286 | Tragic 31.3% |
| Ottawa | 0.1 /100 | #287 | Tragic 31.1% |
| Guatemalans | 0.1 /100 | #288 | Tragic 31.0% |
| Puerto Ricans | 0.1 /100 | #289 | Tragic 31.0% |
| Immigrants | Honduras | 0.1 /100 | #290 | Tragic 30.9% |
| Blacks/African Americans | 0.1 /100 | #291 | Tragic 30.9% |
Demographics Similar to Spanish American Indians by Bachelor's Degree
In terms of bachelor's degree, the demographic groups most similar to Spanish American Indians are Immigrants from Central America (27.5%, a difference of 0.060%), Immigrants from the Azores (27.3%, a difference of 0.48%), Menominee (27.3%, a difference of 0.58%), Crow (27.7%, a difference of 1.1%), and Mexican (27.1%, a difference of 1.4%).
| Demographics | Rating | Rank | Bachelor's Degree |
| Fijians | 0.0 /100 | #323 | Tragic 28.7% |
| Dutch West Indians | 0.0 /100 | #324 | Tragic 28.5% |
| Pennsylvania Germans | 0.0 /100 | #325 | Tragic 28.4% |
| Apache | 0.0 /100 | #326 | Tragic 28.3% |
| Paiute | 0.0 /100 | #327 | Tragic 28.1% |
| Crow | 0.0 /100 | #328 | Tragic 27.7% |
| Immigrants | Central America | 0.0 /100 | #329 | Tragic 27.5% |
| Spanish American Indians | 0.0 /100 | #330 | Tragic 27.5% |
| Immigrants | Azores | 0.0 /100 | #331 | Tragic 27.3% |
| Menominee | 0.0 /100 | #332 | Tragic 27.3% |
| Mexicans | 0.0 /100 | #333 | Tragic 27.1% |
| Arapaho | 0.0 /100 | #334 | Tragic 26.6% |
| Natives/Alaskans | 0.0 /100 | #335 | Tragic 26.3% |
| Immigrants | Mexico | 0.0 /100 | #336 | Tragic 26.1% |
| Inupiat | 0.0 /100 | #337 | Tragic 25.8% |