Guatemalan vs Basque Average Family Size
COMPARE
Guatemalan
Basque
Average Family Size
Average Family Size Comparison
Guatemalans
Basques
3.40
AVERAGE FAMILY SIZE
100.0/ 100
METRIC RATING
35th/ 347
METRIC RANK
3.19
AVERAGE FAMILY SIZE
5.2/ 100
METRIC RATING
231st/ 347
METRIC RANK
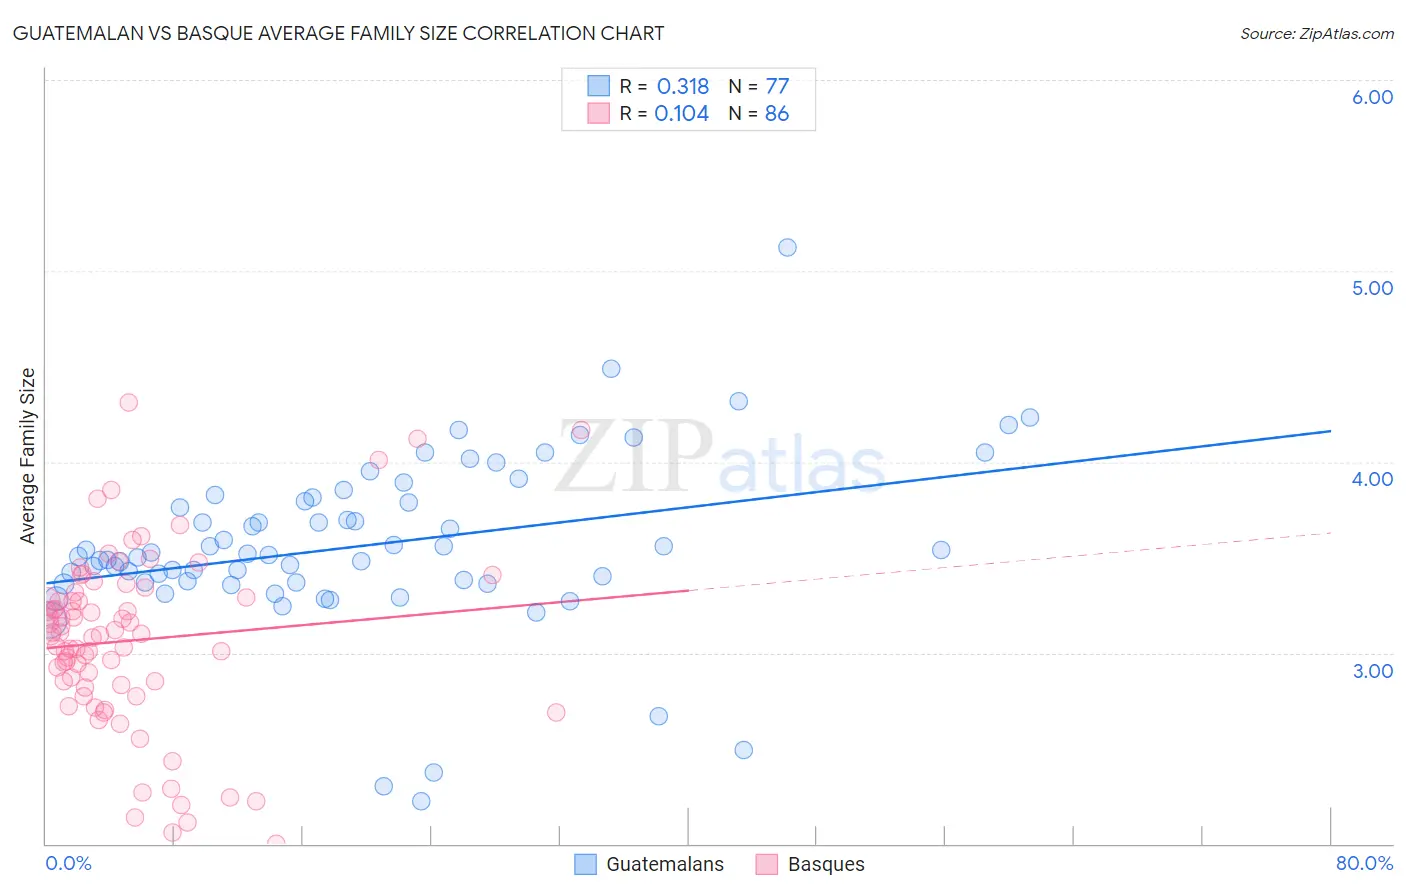
Guatemalan vs Basque Average Family Size Correlation Chart
The statistical analysis conducted on geographies consisting of 409,298,058 people shows a mild positive correlation between the proportion of Guatemalans and average family size in the United States with a correlation coefficient (R) of 0.318 and weighted average of 3.40. Similarly, the statistical analysis conducted on geographies consisting of 165,752,068 people shows a poor positive correlation between the proportion of Basques and average family size in the United States with a correlation coefficient (R) of 0.104 and weighted average of 3.19, a difference of 6.9%.
Average Family Size Correlation Summary
| Measurement | Guatemalan | Basque |
| Minimum | 2.22 | 2.00 |
| Maximum | 5.12 | 4.31 |
| Range | 2.90 | 2.31 |
| Mean | 3.56 | 3.06 |
| Median | 3.51 | 3.10 |
| Interquartile 25% (IQ1) | 3.37 | 2.83 |
| Interquartile 75% (IQ3) | 3.80 | 3.29 |
| Interquartile Range (IQR) | 0.44 | 0.46 |
| Standard Deviation (Sample) | 0.46 | 0.47 |
| Standard Deviation (Population) | 0.45 | 0.46 |
Similar Demographics by Average Family Size
Demographics Similar to Guatemalans by Average Family Size
In terms of average family size, the demographic groups most similar to Guatemalans are Immigrants from Guyana (3.40, a difference of 0.050%), Hispanic or Latino (3.41, a difference of 0.060%), Hawaiian (3.41, a difference of 0.12%), Immigrants from Guatemala (3.41, a difference of 0.14%), and Guyanese (3.40, a difference of 0.19%).
| Demographics | Rating | Rank | Average Family Size |
| Immigrants | Latin America | 100.0 /100 | #28 | Exceptional 3.42 |
| Nepalese | 100.0 /100 | #29 | Exceptional 3.42 |
| Samoans | 100.0 /100 | #30 | Exceptional 3.42 |
| Central Americans | 100.0 /100 | #31 | Exceptional 3.41 |
| Immigrants | Guatemala | 100.0 /100 | #32 | Exceptional 3.41 |
| Hawaiians | 100.0 /100 | #33 | Exceptional 3.41 |
| Hispanics or Latinos | 100.0 /100 | #34 | Exceptional 3.41 |
| Guatemalans | 100.0 /100 | #35 | Exceptional 3.40 |
| Immigrants | Guyana | 100.0 /100 | #36 | Exceptional 3.40 |
| Guyanese | 100.0 /100 | #37 | Exceptional 3.40 |
| Immigrants | Belize | 100.0 /100 | #38 | Exceptional 3.39 |
| Immigrants | Haiti | 100.0 /100 | #39 | Exceptional 3.39 |
| Belizeans | 100.0 /100 | #40 | Exceptional 3.39 |
| Marshallese | 100.0 /100 | #41 | Exceptional 3.38 |
| Immigrants | Vietnam | 100.0 /100 | #42 | Exceptional 3.38 |
Demographics Similar to Basques by Average Family Size
In terms of average family size, the demographic groups most similar to Basques are Icelander (3.19, a difference of 0.0%), Immigrants from Italy (3.19, a difference of 0.010%), Cherokee (3.18, a difference of 0.040%), Nonimmigrants (3.19, a difference of 0.050%), and Portuguese (3.19, a difference of 0.070%).
| Demographics | Rating | Rank | Average Family Size |
| Syrians | 6.5 /100 | #224 | Tragic 3.19 |
| Cree | 6.2 /100 | #225 | Tragic 3.19 |
| Chickasaw | 6.0 /100 | #226 | Tragic 3.19 |
| Portuguese | 6.0 /100 | #227 | Tragic 3.19 |
| Immigrants | Nonimmigrants | 5.7 /100 | #228 | Tragic 3.19 |
| Immigrants | Italy | 5.3 /100 | #229 | Tragic 3.19 |
| Icelanders | 5.2 /100 | #230 | Tragic 3.19 |
| Basques | 5.2 /100 | #231 | Tragic 3.19 |
| Cherokee | 4.7 /100 | #232 | Tragic 3.18 |
| Brazilians | 4.5 /100 | #233 | Tragic 3.18 |
| Iranians | 4.5 /100 | #234 | Tragic 3.18 |
| Immigrants | Turkey | 4.2 /100 | #235 | Tragic 3.18 |
| Immigrants | Portugal | 4.2 /100 | #236 | Tragic 3.18 |
| Immigrants | Romania | 3.7 /100 | #237 | Tragic 3.18 |
| Romanians | 3.7 /100 | #238 | Tragic 3.18 |