Guamanian/Chamorro vs Lithuanian Unemployment Among Women with Children Ages 6 to 17 years
COMPARE
Guamanian/Chamorro
Lithuanian
Unemployment Among Women with Children Ages 6 to 17 years
Unemployment Among Women with Children Ages 6 to 17 years Comparison
Guamanians/Chamorros
Lithuanians
9.1%
UNEMPLOYMENT AMONG WOMEN WITH CHILDREN AGES 6 TO 17 YEARS
27.2/ 100
METRIC RATING
192nd/ 347
METRIC RANK
9.4%
UNEMPLOYMENT AMONG WOMEN WITH CHILDREN AGES 6 TO 17 YEARS
0.9/ 100
METRIC RATING
255th/ 347
METRIC RANK
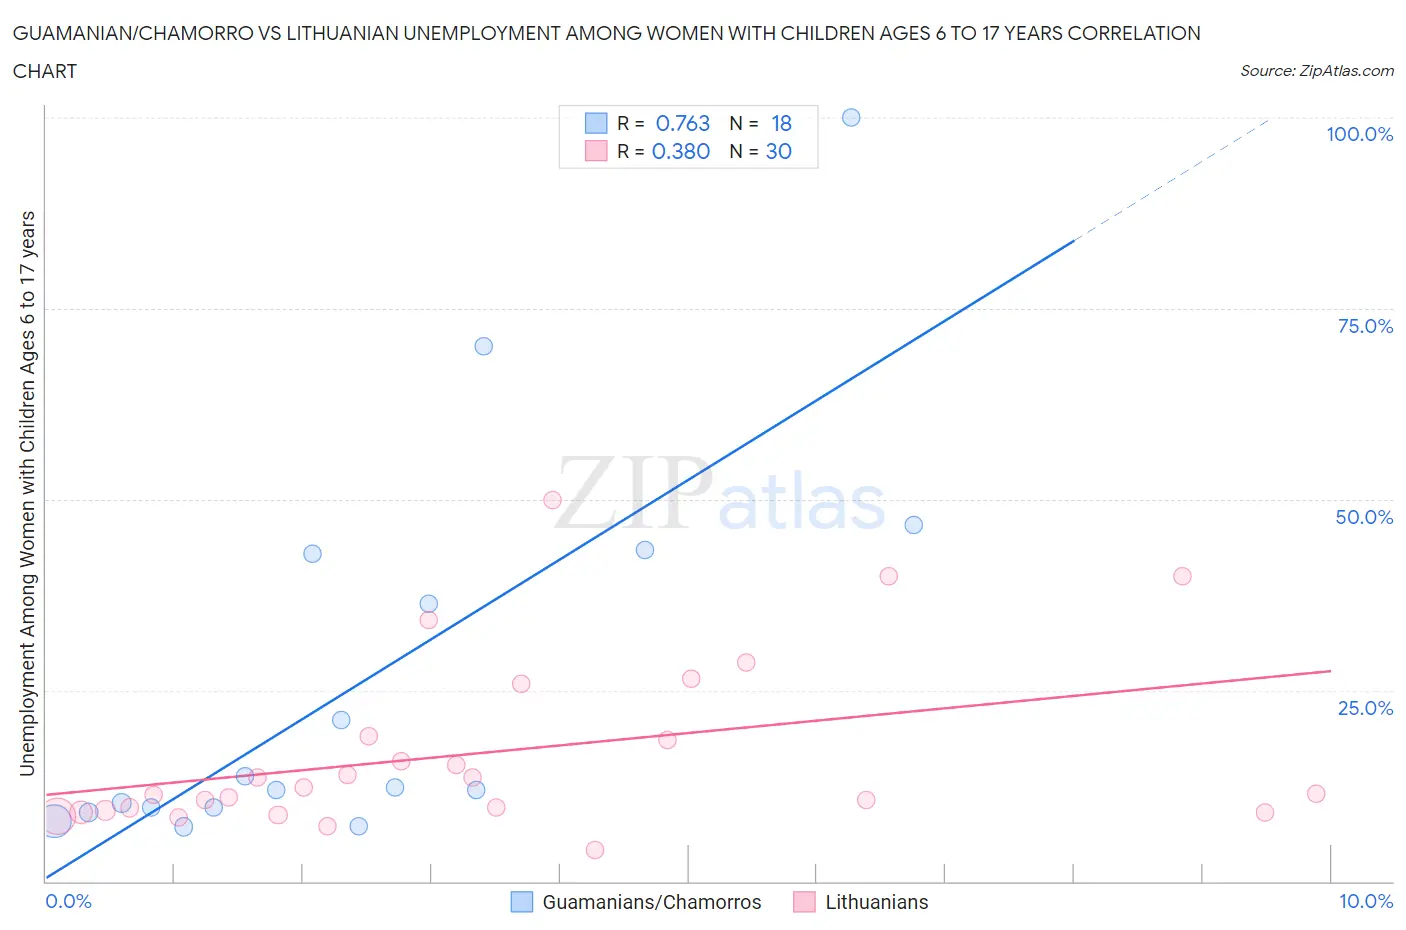
Guamanian/Chamorro vs Lithuanian Unemployment Among Women with Children Ages 6 to 17 years Correlation Chart
The statistical analysis conducted on geographies consisting of 180,746,926 people shows a strong positive correlation between the proportion of Guamanians/Chamorros and unemployment rate among women with children between the ages 6 and 17 in the United States with a correlation coefficient (R) of 0.763 and weighted average of 9.1%. Similarly, the statistical analysis conducted on geographies consisting of 288,737,051 people shows a mild positive correlation between the proportion of Lithuanians and unemployment rate among women with children between the ages 6 and 17 in the United States with a correlation coefficient (R) of 0.380 and weighted average of 9.4%, a difference of 4.1%.
Unemployment Among Women with Children Ages 6 to 17 years Correlation Summary
| Measurement | Guamanian/Chamorro | Lithuanian |
| Minimum | 7.1% | 4.1% |
| Maximum | 100.0% | 50.0% |
| Range | 92.9% | 45.9% |
| Mean | 26.2% | 16.9% |
| Median | 12.1% | 11.9% |
| Interquartile 25% (IQ1) | 9.6% | 9.3% |
| Interquartile 75% (IQ3) | 42.9% | 18.9% |
| Interquartile Range (IQR) | 33.3% | 9.6% |
| Standard Deviation (Sample) | 25.9% | 11.4% |
| Standard Deviation (Population) | 25.2% | 11.2% |
Similar Demographics by Unemployment Among Women with Children Ages 6 to 17 years
Demographics Similar to Guamanians/Chamorros by Unemployment Among Women with Children Ages 6 to 17 years
In terms of unemployment among women with children ages 6 to 17 years, the demographic groups most similar to Guamanians/Chamorros are Slovene (9.1%, a difference of 0.070%), Belizean (9.1%, a difference of 0.070%), Immigrants from Turkey (9.1%, a difference of 0.070%), Immigrants (9.1%, a difference of 0.11%), and Immigrants from Kazakhstan (9.1%, a difference of 0.11%).
| Demographics | Rating | Rank | Unemployment Among Women with Children Ages 6 to 17 years |
| Immigrants | Congo | 32.5 /100 | #185 | Fair 9.0% |
| Immigrants | Spain | 32.4 /100 | #186 | Fair 9.0% |
| Comanche | 30.0 /100 | #187 | Fair 9.0% |
| Immigrants | Syria | 29.7 /100 | #188 | Fair 9.1% |
| Immigrants | Immigrants | 29.2 /100 | #189 | Fair 9.1% |
| Slovenes | 28.5 /100 | #190 | Fair 9.1% |
| Belizeans | 28.4 /100 | #191 | Fair 9.1% |
| Guamanians/Chamorros | 27.2 /100 | #192 | Fair 9.1% |
| Immigrants | Turkey | 25.8 /100 | #193 | Fair 9.1% |
| Immigrants | Kazakhstan | 25.3 /100 | #194 | Fair 9.1% |
| Austrians | 25.0 /100 | #195 | Fair 9.1% |
| Brazilians | 24.4 /100 | #196 | Fair 9.1% |
| Immigrants | Panama | 24.3 /100 | #197 | Fair 9.1% |
| Guyanese | 21.8 /100 | #198 | Fair 9.1% |
| Czechoslovakians | 20.8 /100 | #199 | Fair 9.1% |
Demographics Similar to Lithuanians by Unemployment Among Women with Children Ages 6 to 17 years
In terms of unemployment among women with children ages 6 to 17 years, the demographic groups most similar to Lithuanians are Nicaraguan (9.4%, a difference of 0.060%), Canadian (9.4%, a difference of 0.17%), Celtic (9.5%, a difference of 0.19%), Portuguese (9.4%, a difference of 0.23%), and Immigrants from Mexico (9.5%, a difference of 0.28%).
| Demographics | Rating | Rank | Unemployment Among Women with Children Ages 6 to 17 years |
| Dutch | 1.5 /100 | #248 | Tragic 9.4% |
| Immigrants | South America | 1.5 /100 | #249 | Tragic 9.4% |
| Immigrants | Guatemala | 1.3 /100 | #250 | Tragic 9.4% |
| Central Americans | 1.3 /100 | #251 | Tragic 9.4% |
| Creek | 1.2 /100 | #252 | Tragic 9.4% |
| Portuguese | 1.1 /100 | #253 | Tragic 9.4% |
| Nicaraguans | 1.0 /100 | #254 | Tragic 9.4% |
| Lithuanians | 0.9 /100 | #255 | Tragic 9.4% |
| Canadians | 0.8 /100 | #256 | Tragic 9.4% |
| Celtics | 0.7 /100 | #257 | Tragic 9.5% |
| Immigrants | Mexico | 0.7 /100 | #258 | Tragic 9.5% |
| Immigrants | Central America | 0.6 /100 | #259 | Tragic 9.5% |
| Italians | 0.6 /100 | #260 | Tragic 9.5% |
| South Americans | 0.5 /100 | #261 | Tragic 9.5% |
| Senegalese | 0.5 /100 | #262 | Tragic 9.5% |