Immigrants from Taiwan vs Immigrants from Oceania Single Father Households
COMPARE
Immigrants from Taiwan
Immigrants from Oceania
Single Father Households
Single Father Households Comparison
Immigrants from Taiwan
Immigrants from Oceania
1.8%
SINGLE FATHER HOUSEHOLDS
100.0/ 100
METRIC RATING
6th/ 347
METRIC RANK
2.5%
SINGLE FATHER HOUSEHOLDS
5.8/ 100
METRIC RATING
239th/ 347
METRIC RANK
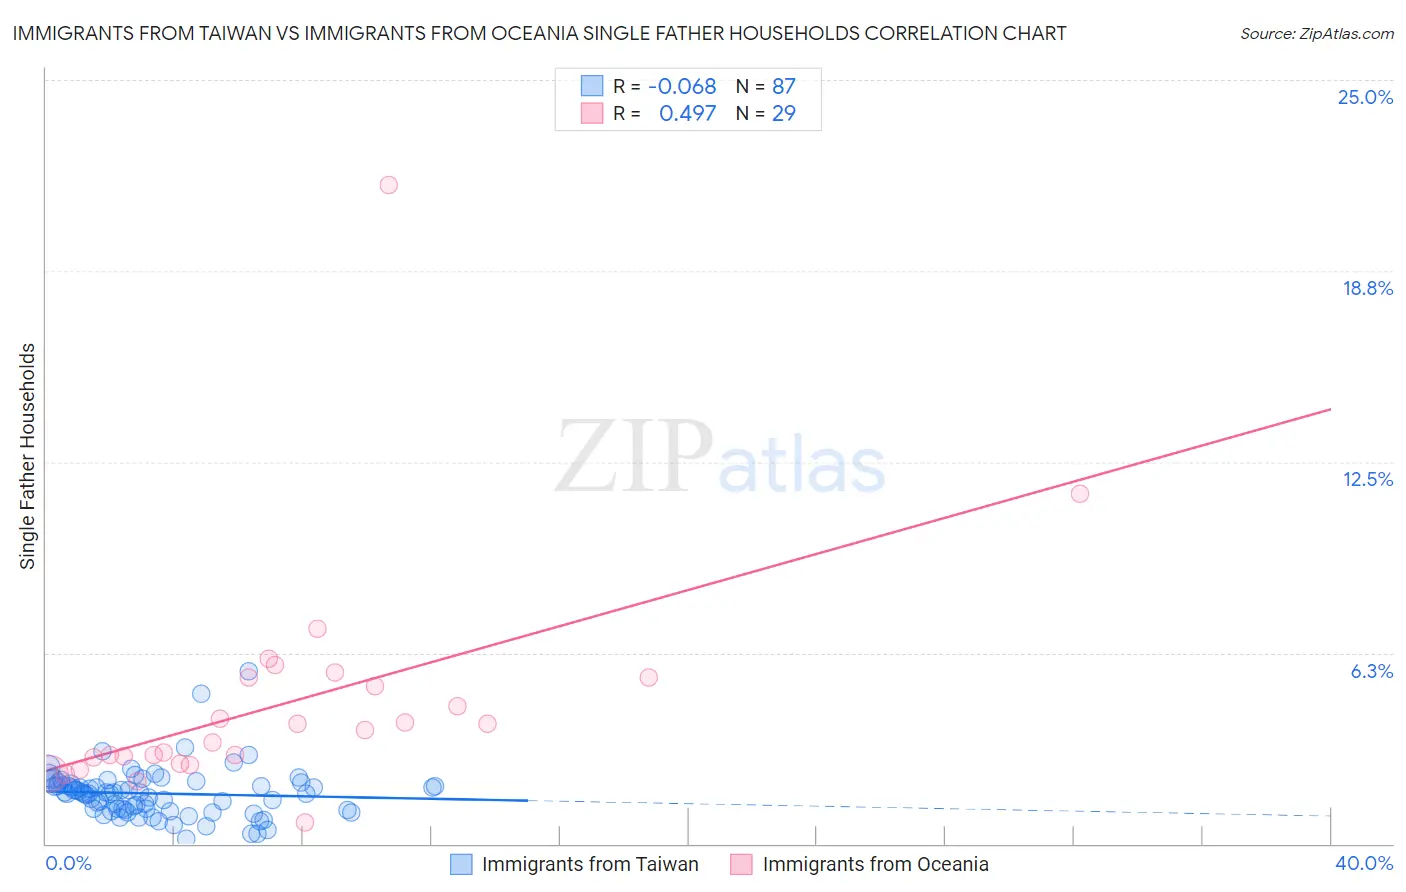
Immigrants from Taiwan vs Immigrants from Oceania Single Father Households Correlation Chart
The statistical analysis conducted on geographies consisting of 296,358,565 people shows a slight negative correlation between the proportion of Immigrants from Taiwan and percentage of single father households in the United States with a correlation coefficient (R) of -0.068 and weighted average of 1.8%. Similarly, the statistical analysis conducted on geographies consisting of 303,379,404 people shows a moderate positive correlation between the proportion of Immigrants from Oceania and percentage of single father households in the United States with a correlation coefficient (R) of 0.497 and weighted average of 2.5%, a difference of 33.7%.
Single Father Households Correlation Summary
| Measurement | Immigrants from Taiwan | Immigrants from Oceania |
| Minimum | 0.15% | 0.70% |
| Maximum | 5.7% | 21.5% |
| Range | 5.5% | 20.8% |
| Mean | 1.6% | 4.6% |
| Median | 1.7% | 3.7% |
| Interquartile 25% (IQ1) | 1.1% | 2.7% |
| Interquartile 75% (IQ3) | 1.9% | 5.4% |
| Interquartile Range (IQR) | 0.84% | 2.7% |
| Standard Deviation (Sample) | 0.82% | 3.8% |
| Standard Deviation (Population) | 0.82% | 3.8% |
Similar Demographics by Single Father Households
Demographics Similar to Immigrants from Taiwan by Single Father Households
In terms of single father households, the demographic groups most similar to Immigrants from Taiwan are Cypriot (1.8%, a difference of 0.16%), Immigrants from Ireland (1.8%, a difference of 0.27%), Immigrants from Hong Kong (1.8%, a difference of 0.37%), Immigrants from China (1.8%, a difference of 0.40%), and Okinawan (1.9%, a difference of 0.76%).
| Demographics | Rating | Rank | Single Father Households |
| Soviet Union | 100.0 /100 | #1 | Exceptional 1.8% |
| Immigrants | Israel | 100.0 /100 | #2 | Exceptional 1.8% |
| Filipinos | 100.0 /100 | #3 | Exceptional 1.8% |
| Immigrants | Uzbekistan | 100.0 /100 | #4 | Exceptional 1.8% |
| Immigrants | Hong Kong | 100.0 /100 | #5 | Exceptional 1.8% |
| Immigrants | Taiwan | 100.0 /100 | #6 | Exceptional 1.8% |
| Cypriots | 100.0 /100 | #7 | Exceptional 1.8% |
| Immigrants | Ireland | 100.0 /100 | #8 | Exceptional 1.8% |
| Immigrants | China | 100.0 /100 | #9 | Exceptional 1.8% |
| Okinawans | 100.0 /100 | #10 | Exceptional 1.9% |
| Immigrants | Belarus | 100.0 /100 | #11 | Exceptional 1.9% |
| Immigrants | Greece | 100.0 /100 | #12 | Exceptional 1.9% |
| Immigrants | Singapore | 100.0 /100 | #13 | Exceptional 1.9% |
| Immigrants | Lithuania | 100.0 /100 | #14 | Exceptional 1.9% |
| Immigrants | Eastern Asia | 100.0 /100 | #15 | Exceptional 1.9% |
Demographics Similar to Immigrants from Oceania by Single Father Households
In terms of single father households, the demographic groups most similar to Immigrants from Oceania are Immigrants from Sierra Leone (2.5%, a difference of 0.010%), Sierra Leonean (2.5%, a difference of 0.040%), Cajun (2.5%, a difference of 0.090%), Immigrants (2.5%, a difference of 0.14%), and African (2.5%, a difference of 0.16%).
| Demographics | Rating | Rank | Single Father Households |
| Pennsylvania Germans | 7.3 /100 | #232 | Tragic 2.4% |
| Immigrants | Western Africa | 7.0 /100 | #233 | Tragic 2.4% |
| Africans | 6.3 /100 | #234 | Tragic 2.5% |
| Immigrants | Immigrants | 6.3 /100 | #235 | Tragic 2.5% |
| Cajuns | 6.1 /100 | #236 | Tragic 2.5% |
| Sierra Leoneans | 5.9 /100 | #237 | Tragic 2.5% |
| Immigrants | Sierra Leone | 5.8 /100 | #238 | Tragic 2.5% |
| Immigrants | Oceania | 5.8 /100 | #239 | Tragic 2.5% |
| Immigrants | Dominica | 4.8 /100 | #240 | Tragic 2.5% |
| Portuguese | 4.1 /100 | #241 | Tragic 2.5% |
| Osage | 4.1 /100 | #242 | Tragic 2.5% |
| Spaniards | 3.1 /100 | #243 | Tragic 2.5% |
| Immigrants | Middle Africa | 2.8 /100 | #244 | Tragic 2.5% |
| Basques | 2.5 /100 | #245 | Tragic 2.5% |
| Native Hawaiians | 2.5 /100 | #246 | Tragic 2.5% |