Guamanian/Chamorro vs Estonian Divorced or Separated
COMPARE
Guamanian/Chamorro
Estonian
Divorced or Separated
Divorced or Separated Comparison
Guamanians/Chamorros
Estonians
12.3%
DIVORCED OR SEPARATED
11.3/ 100
METRIC RATING
221st/ 347
METRIC RANK
11.7%
DIVORCED OR SEPARATED
96.6/ 100
METRIC RATING
113th/ 347
METRIC RANK
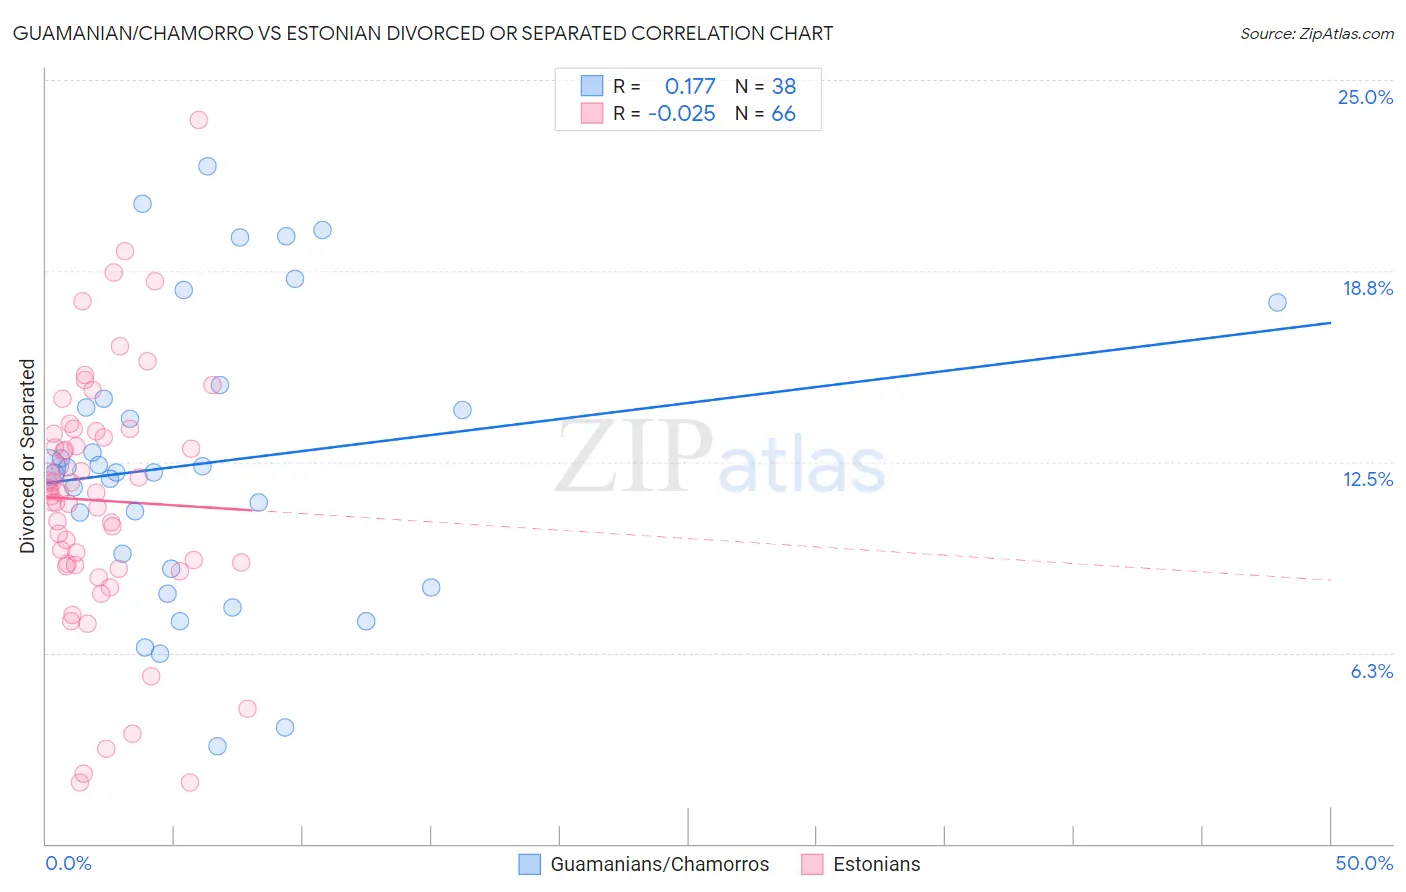
Guamanian/Chamorro vs Estonian Divorced or Separated Correlation Chart
The statistical analysis conducted on geographies consisting of 221,943,719 people shows a poor positive correlation between the proportion of Guamanians/Chamorros and percentage of population currently divorced or separated in the United States with a correlation coefficient (R) of 0.177 and weighted average of 12.3%. Similarly, the statistical analysis conducted on geographies consisting of 123,504,002 people shows no correlation between the proportion of Estonians and percentage of population currently divorced or separated in the United States with a correlation coefficient (R) of -0.025 and weighted average of 11.7%, a difference of 4.8%.
Divorced or Separated Correlation Summary
| Measurement | Guamanian/Chamorro | Estonian |
| Minimum | 3.2% | 2.0% |
| Maximum | 22.2% | 23.7% |
| Range | 19.0% | 21.7% |
| Mean | 12.5% | 11.2% |
| Median | 12.2% | 11.5% |
| Interquartile 25% (IQ1) | 9.0% | 9.1% |
| Interquartile 75% (IQ3) | 14.6% | 13.4% |
| Interquartile Range (IQR) | 5.6% | 4.3% |
| Standard Deviation (Sample) | 4.7% | 4.1% |
| Standard Deviation (Population) | 4.7% | 4.1% |
Similar Demographics by Divorced or Separated
Demographics Similar to Guamanians/Chamorros by Divorced or Separated
In terms of divorced or separated, the demographic groups most similar to Guamanians/Chamorros are Czechoslovakian (12.3%, a difference of 0.030%), British (12.3%, a difference of 0.030%), Bangladeshi (12.3%, a difference of 0.070%), Scandinavian (12.3%, a difference of 0.080%), and Slovene (12.3%, a difference of 0.15%).
| Demographics | Rating | Rank | Divorced or Separated |
| Immigrants | Argentina | 15.5 /100 | #214 | Poor 12.2% |
| Europeans | 15.4 /100 | #215 | Poor 12.2% |
| Immigrants | South America | 15.4 /100 | #216 | Poor 12.2% |
| Northern Europeans | 14.7 /100 | #217 | Poor 12.2% |
| Slovenes | 13.2 /100 | #218 | Poor 12.3% |
| Czechoslovakians | 11.7 /100 | #219 | Poor 12.3% |
| British | 11.6 /100 | #220 | Poor 12.3% |
| Guamanians/Chamorros | 11.3 /100 | #221 | Poor 12.3% |
| Bangladeshis | 10.5 /100 | #222 | Poor 12.3% |
| Scandinavians | 10.4 /100 | #223 | Poor 12.3% |
| Immigrants | Azores | 9.7 /100 | #224 | Tragic 12.3% |
| Belgians | 9.7 /100 | #225 | Tragic 12.3% |
| Immigrants | Western Africa | 9.3 /100 | #226 | Tragic 12.3% |
| Hmong | 8.8 /100 | #227 | Tragic 12.3% |
| Immigrants | Cameroon | 8.3 /100 | #228 | Tragic 12.3% |
Demographics Similar to Estonians by Divorced or Separated
In terms of divorced or separated, the demographic groups most similar to Estonians are Immigrants from France (11.7%, a difference of 0.0%), Immigrants from Spain (11.7%, a difference of 0.050%), Immigrants from South Africa (11.7%, a difference of 0.090%), Immigrants from Czechoslovakia (11.7%, a difference of 0.090%), and Greek (11.7%, a difference of 0.10%).
| Demographics | Rating | Rank | Divorced or Separated |
| Immigrants | Kazakhstan | 97.8 /100 | #106 | Exceptional 11.7% |
| Native Hawaiians | 97.2 /100 | #107 | Exceptional 11.7% |
| Greeks | 96.9 /100 | #108 | Exceptional 11.7% |
| Immigrants | South Africa | 96.9 /100 | #109 | Exceptional 11.7% |
| Immigrants | Czechoslovakia | 96.9 /100 | #110 | Exceptional 11.7% |
| Immigrants | Spain | 96.8 /100 | #111 | Exceptional 11.7% |
| Immigrants | France | 96.6 /100 | #112 | Exceptional 11.7% |
| Estonians | 96.6 /100 | #113 | Exceptional 11.7% |
| Immigrants | Norway | 95.9 /100 | #114 | Exceptional 11.7% |
| Lithuanians | 95.7 /100 | #115 | Exceptional 11.7% |
| Immigrants | Iraq | 95.4 /100 | #116 | Exceptional 11.7% |
| Immigrants | Uganda | 95.3 /100 | #117 | Exceptional 11.7% |
| Ecuadorians | 95.3 /100 | #118 | Exceptional 11.7% |
| Syrians | 95.1 /100 | #119 | Exceptional 11.7% |
| Iraqis | 94.6 /100 | #120 | Exceptional 11.8% |