Greek vs Lumbee Currently Married
COMPARE
Greek
Lumbee
Currently Married
Currently Married Comparison
Greeks
Lumbee
48.8%
CURRENTLY MARRIED
99.3/ 100
METRIC RATING
41st/ 347
METRIC RANK
39.8%
CURRENTLY MARRIED
0.0/ 100
METRIC RATING
335th/ 347
METRIC RANK
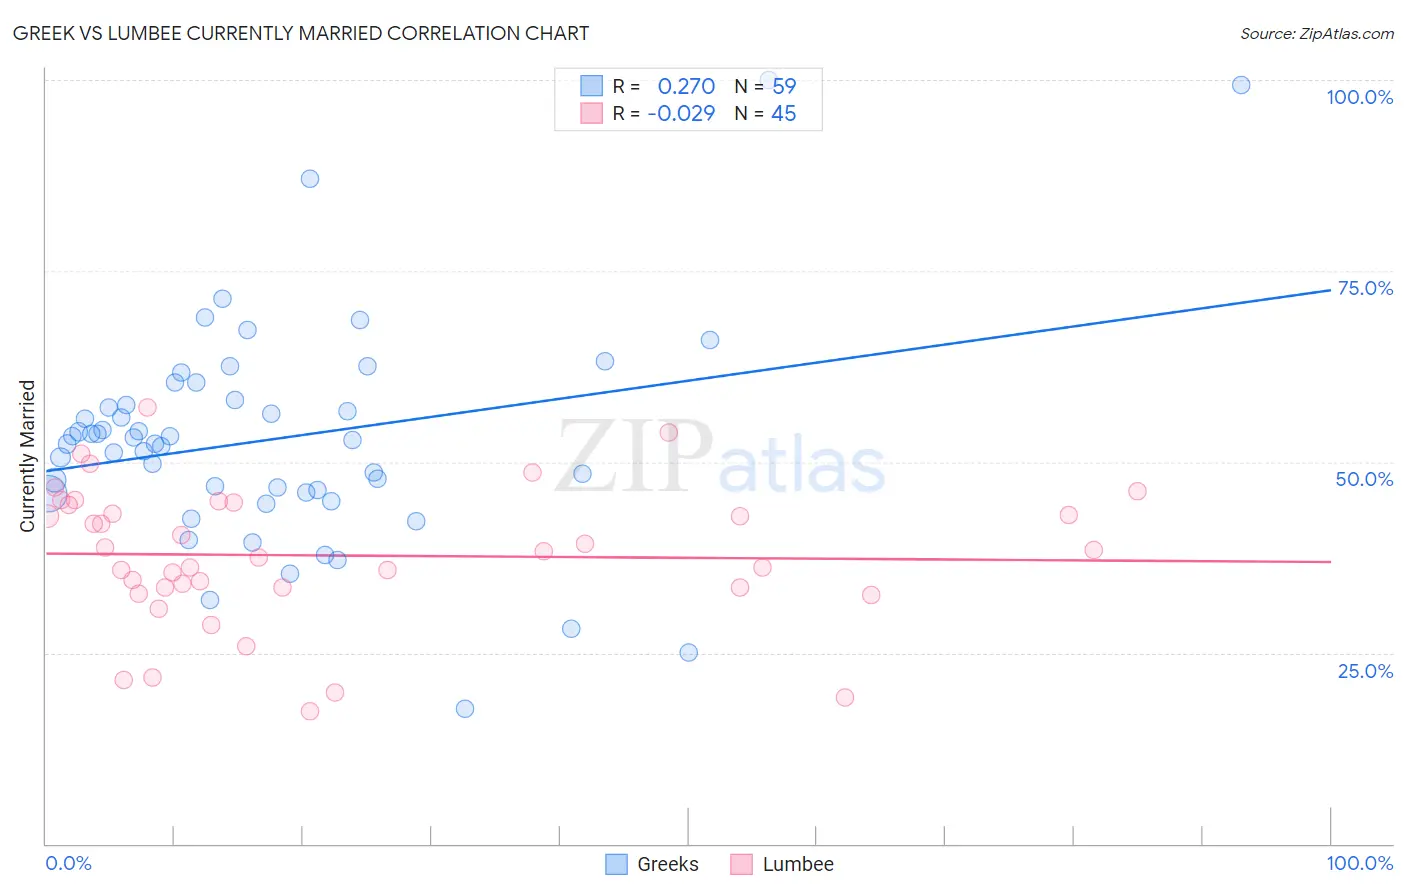
Greek vs Lumbee Currently Married Correlation Chart
The statistical analysis conducted on geographies consisting of 482,696,171 people shows a weak positive correlation between the proportion of Greeks and percentage of population currently married in the United States with a correlation coefficient (R) of 0.270 and weighted average of 48.8%. Similarly, the statistical analysis conducted on geographies consisting of 92,298,299 people shows no correlation between the proportion of Lumbee and percentage of population currently married in the United States with a correlation coefficient (R) of -0.029 and weighted average of 39.8%, a difference of 22.4%.
Currently Married Correlation Summary
| Measurement | Greek | Lumbee |
| Minimum | 17.7% | 17.4% |
| Maximum | 100.0% | 57.2% |
| Range | 82.3% | 39.8% |
| Mean | 53.0% | 37.7% |
| Median | 52.8% | 38.3% |
| Interquartile 25% (IQ1) | 46.0% | 33.5% |
| Interquartile 75% (IQ3) | 58.1% | 44.5% |
| Interquartile Range (IQR) | 12.1% | 10.9% |
| Standard Deviation (Sample) | 14.5% | 9.1% |
| Standard Deviation (Population) | 14.4% | 9.0% |
Similar Demographics by Currently Married
Demographics Similar to Greeks by Currently Married
In terms of currently married, the demographic groups most similar to Greeks are Immigrants from Canada (48.8%, a difference of 0.020%), British (48.8%, a difference of 0.040%), Finnish (48.8%, a difference of 0.050%), Scotch-Irish (48.7%, a difference of 0.050%), and Czechoslovakian (48.8%, a difference of 0.070%).
| Demographics | Rating | Rank | Currently Married |
| Immigrants | Lithuania | 99.4 /100 | #34 | Exceptional 48.8% |
| Immigrants | Northern Europe | 99.4 /100 | #35 | Exceptional 48.8% |
| Italians | 99.4 /100 | #36 | Exceptional 48.8% |
| Hungarians | 99.4 /100 | #37 | Exceptional 48.8% |
| Czechoslovakians | 99.4 /100 | #38 | Exceptional 48.8% |
| British | 99.4 /100 | #39 | Exceptional 48.8% |
| Immigrants | Canada | 99.4 /100 | #40 | Exceptional 48.8% |
| Greeks | 99.3 /100 | #41 | Exceptional 48.8% |
| Finns | 99.3 /100 | #42 | Exceptional 48.8% |
| Scotch-Irish | 99.3 /100 | #43 | Exceptional 48.7% |
| Immigrants | North America | 99.3 /100 | #44 | Exceptional 48.7% |
| Belgians | 99.3 /100 | #45 | Exceptional 48.7% |
| Immigrants | Iran | 99.2 /100 | #46 | Exceptional 48.7% |
| Northern Europeans | 99.2 /100 | #47 | Exceptional 48.7% |
| Austrians | 99.2 /100 | #48 | Exceptional 48.7% |
Demographics Similar to Lumbee by Currently Married
In terms of currently married, the demographic groups most similar to Lumbee are Puerto Rican (39.9%, a difference of 0.16%), Yup'ik (39.9%, a difference of 0.18%), British West Indian (39.8%, a difference of 0.18%), Black/African American (39.6%, a difference of 0.56%), and Immigrants from St. Vincent and the Grenadines (40.1%, a difference of 0.57%).
| Demographics | Rating | Rank | Currently Married |
| Arapaho | 0.0 /100 | #328 | Tragic 40.5% |
| Crow | 0.0 /100 | #329 | Tragic 40.4% |
| Immigrants | Dominica | 0.0 /100 | #330 | Tragic 40.3% |
| Immigrants | Barbados | 0.0 /100 | #331 | Tragic 40.3% |
| Immigrants | St. Vincent and the Grenadines | 0.0 /100 | #332 | Tragic 40.1% |
| Yup'ik | 0.0 /100 | #333 | Tragic 39.9% |
| Puerto Ricans | 0.0 /100 | #334 | Tragic 39.9% |
| Lumbee | 0.0 /100 | #335 | Tragic 39.8% |
| British West Indians | 0.0 /100 | #336 | Tragic 39.8% |
| Blacks/African Americans | 0.0 /100 | #337 | Tragic 39.6% |
| Cape Verdeans | 0.0 /100 | #338 | Tragic 39.6% |
| Dominicans | 0.0 /100 | #339 | Tragic 39.5% |
| Immigrants | Grenada | 0.0 /100 | #340 | Tragic 39.1% |
| Navajo | 0.0 /100 | #341 | Tragic 39.0% |
| Immigrants | Dominican Republic | 0.0 /100 | #342 | Tragic 38.9% |