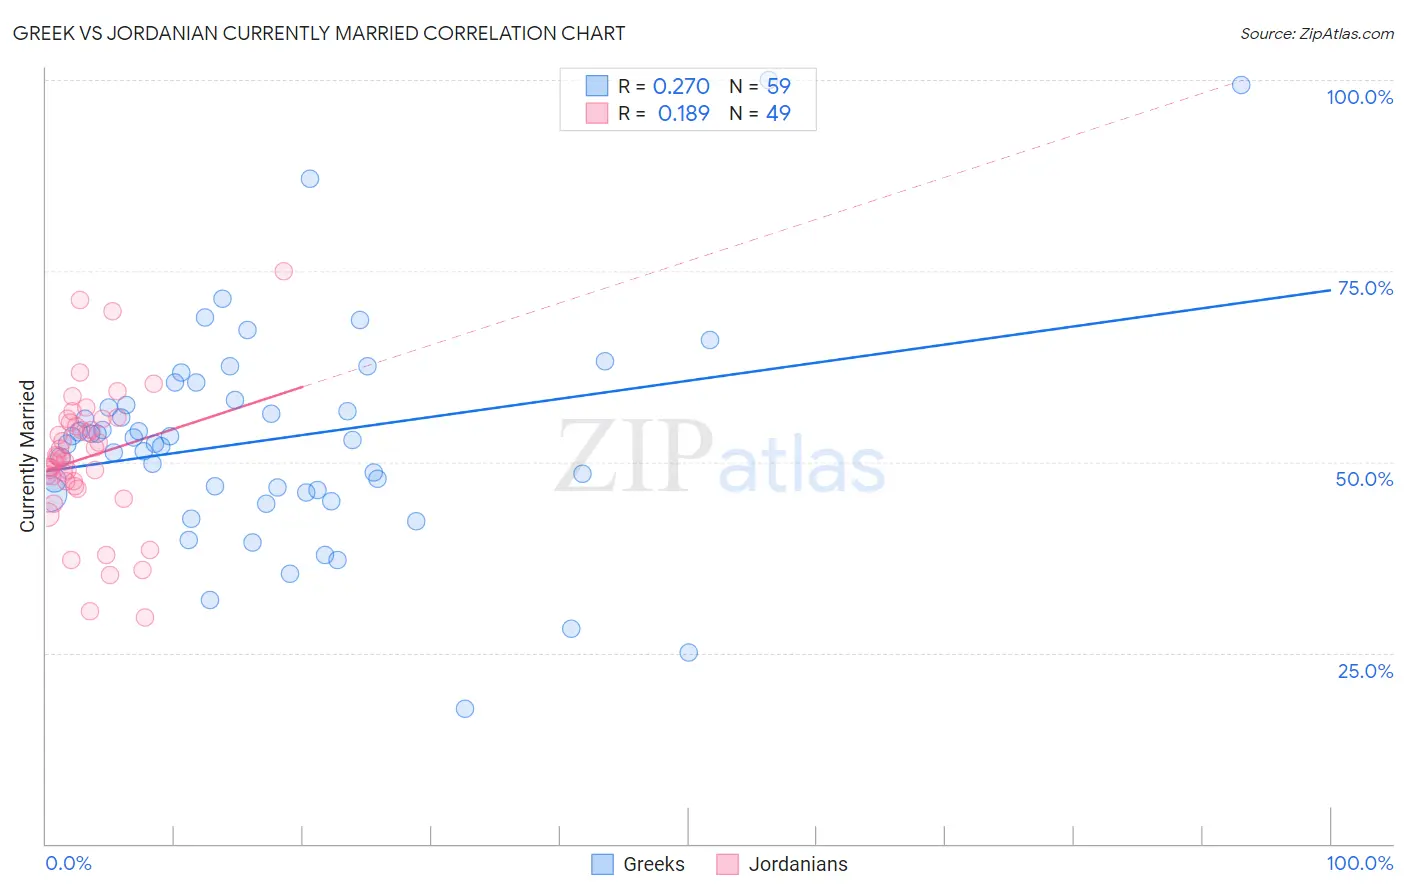
Greek vs Jordanian Currently Married
COMPARE
Greek
Jordanian
Currently Married
Currently Married Comparison
Greeks
Jordanians
48.8%
CURRENTLY MARRIED
99.3/ 100
METRIC RATING
41st/ 347
METRIC RANK
48.0%
CURRENTLY MARRIED
96.2/ 100
METRIC RATING
87th/ 347
METRIC RANK
Greek vs Jordanian Currently Married Correlation Chart
The statistical analysis conducted on geographies consisting of 482,696,171 people shows a weak positive correlation between the proportion of Greeks and percentage of population currently married in the United States with a correlation coefficient (R) of 0.270 and weighted average of 48.8%. Similarly, the statistical analysis conducted on geographies consisting of 166,415,795 people shows a poor positive correlation between the proportion of Jordanians and percentage of population currently married in the United States with a correlation coefficient (R) of 0.189 and weighted average of 48.0%, a difference of 1.6%.
Currently Married Correlation Summary
| Measurement | Greek | Jordanian |
| Minimum | 17.7% | 29.6% |
| Maximum | 100.0% | 75.0% |
| Range | 82.3% | 45.4% |
| Mean | 53.0% | 50.6% |
| Median | 52.8% | 50.5% |
| Interquartile 25% (IQ1) | 46.0% | 47.1% |
| Interquartile 75% (IQ3) | 58.1% | 55.4% |
| Interquartile Range (IQR) | 12.1% | 8.3% |
| Standard Deviation (Sample) | 14.5% | 9.1% |
| Standard Deviation (Population) | 14.4% | 9.0% |
Similar Demographics by Currently Married
Demographics Similar to Greeks by Currently Married
In terms of currently married, the demographic groups most similar to Greeks are Immigrants from Canada (48.8%, a difference of 0.020%), British (48.8%, a difference of 0.040%), Finnish (48.8%, a difference of 0.050%), Scotch-Irish (48.7%, a difference of 0.050%), and Czechoslovakian (48.8%, a difference of 0.070%).
| Demographics | Rating | Rank | Currently Married |
| Immigrants | Lithuania | 99.4 /100 | #34 | Exceptional 48.8% |
| Immigrants | Northern Europe | 99.4 /100 | #35 | Exceptional 48.8% |
| Italians | 99.4 /100 | #36 | Exceptional 48.8% |
| Hungarians | 99.4 /100 | #37 | Exceptional 48.8% |
| Czechoslovakians | 99.4 /100 | #38 | Exceptional 48.8% |
| British | 99.4 /100 | #39 | Exceptional 48.8% |
| Immigrants | Canada | 99.4 /100 | #40 | Exceptional 48.8% |
| Greeks | 99.3 /100 | #41 | Exceptional 48.8% |
| Finns | 99.3 /100 | #42 | Exceptional 48.8% |
| Scotch-Irish | 99.3 /100 | #43 | Exceptional 48.7% |
| Immigrants | North America | 99.3 /100 | #44 | Exceptional 48.7% |
| Belgians | 99.3 /100 | #45 | Exceptional 48.7% |
| Immigrants | Iran | 99.2 /100 | #46 | Exceptional 48.7% |
| Northern Europeans | 99.2 /100 | #47 | Exceptional 48.7% |
| Austrians | 99.2 /100 | #48 | Exceptional 48.7% |
Demographics Similar to Jordanians by Currently Married
In terms of currently married, the demographic groups most similar to Jordanians are Immigrants from Japan (48.0%, a difference of 0.010%), Immigrants from Eastern Europe (48.0%, a difference of 0.020%), French Canadian (48.0%, a difference of 0.040%), Indian (Asian) (48.0%, a difference of 0.080%), and American (48.0%, a difference of 0.10%).
| Demographics | Rating | Rank | Currently Married |
| Immigrants | Poland | 96.9 /100 | #80 | Exceptional 48.1% |
| Immigrants | Sri Lanka | 96.9 /100 | #81 | Exceptional 48.1% |
| Immigrants | Europe | 96.9 /100 | #82 | Exceptional 48.1% |
| Bolivians | 96.9 /100 | #83 | Exceptional 48.1% |
| Immigrants | Israel | 96.9 /100 | #84 | Exceptional 48.1% |
| French Canadians | 96.3 /100 | #85 | Exceptional 48.0% |
| Immigrants | Japan | 96.2 /100 | #86 | Exceptional 48.0% |
| Jordanians | 96.2 /100 | #87 | Exceptional 48.0% |
| Immigrants | Eastern Europe | 96.1 /100 | #88 | Exceptional 48.0% |
| Indians (Asian) | 95.8 /100 | #89 | Exceptional 48.0% |
| Americans | 95.7 /100 | #90 | Exceptional 48.0% |
| Immigrants | Bolivia | 95.6 /100 | #91 | Exceptional 47.9% |
| Koreans | 95.4 /100 | #92 | Exceptional 47.9% |
| Lebanese | 95.1 /100 | #93 | Exceptional 47.9% |
| Native Hawaiians | 95.0 /100 | #94 | Exceptional 47.9% |