Greek vs Cambodian Currently Married
COMPARE
Greek
Cambodian
Currently Married
Currently Married Comparison
Greeks
Cambodians
48.8%
CURRENTLY MARRIED
99.3/ 100
METRIC RATING
41st/ 347
METRIC RANK
47.0%
CURRENTLY MARRIED
70.4/ 100
METRIC RATING
148th/ 347
METRIC RANK
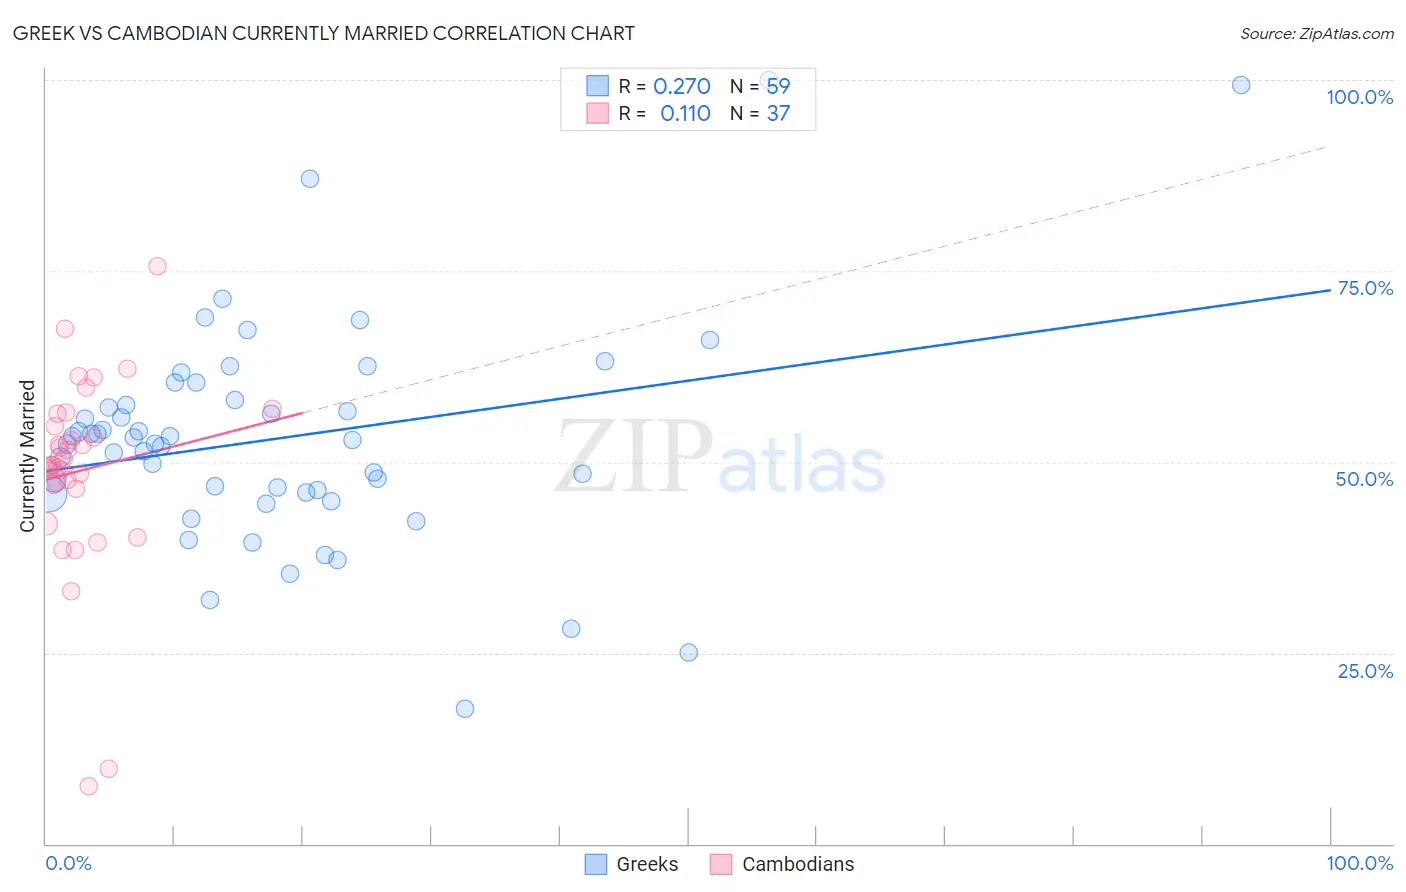
Greek vs Cambodian Currently Married Correlation Chart
The statistical analysis conducted on geographies consisting of 482,696,171 people shows a weak positive correlation between the proportion of Greeks and percentage of population currently married in the United States with a correlation coefficient (R) of 0.270 and weighted average of 48.8%. Similarly, the statistical analysis conducted on geographies consisting of 102,515,172 people shows a poor positive correlation between the proportion of Cambodians and percentage of population currently married in the United States with a correlation coefficient (R) of 0.110 and weighted average of 47.0%, a difference of 3.8%.
Currently Married Correlation Summary
| Measurement | Greek | Cambodian |
| Minimum | 17.7% | 7.6% |
| Maximum | 100.0% | 75.6% |
| Range | 82.3% | 68.0% |
| Mean | 53.0% | 48.8% |
| Median | 52.8% | 49.5% |
| Interquartile 25% (IQ1) | 46.0% | 46.7% |
| Interquartile 75% (IQ3) | 58.1% | 55.5% |
| Interquartile Range (IQR) | 12.1% | 8.8% |
| Standard Deviation (Sample) | 14.5% | 12.8% |
| Standard Deviation (Population) | 14.4% | 12.6% |
Similar Demographics by Currently Married
Demographics Similar to Greeks by Currently Married
In terms of currently married, the demographic groups most similar to Greeks are Immigrants from Canada (48.8%, a difference of 0.020%), British (48.8%, a difference of 0.040%), Finnish (48.8%, a difference of 0.050%), Scotch-Irish (48.7%, a difference of 0.050%), and Czechoslovakian (48.8%, a difference of 0.070%).
| Demographics | Rating | Rank | Currently Married |
| Immigrants | Lithuania | 99.4 /100 | #34 | Exceptional 48.8% |
| Immigrants | Northern Europe | 99.4 /100 | #35 | Exceptional 48.8% |
| Italians | 99.4 /100 | #36 | Exceptional 48.8% |
| Hungarians | 99.4 /100 | #37 | Exceptional 48.8% |
| Czechoslovakians | 99.4 /100 | #38 | Exceptional 48.8% |
| British | 99.4 /100 | #39 | Exceptional 48.8% |
| Immigrants | Canada | 99.4 /100 | #40 | Exceptional 48.8% |
| Greeks | 99.3 /100 | #41 | Exceptional 48.8% |
| Finns | 99.3 /100 | #42 | Exceptional 48.8% |
| Scotch-Irish | 99.3 /100 | #43 | Exceptional 48.7% |
| Immigrants | North America | 99.3 /100 | #44 | Exceptional 48.7% |
| Belgians | 99.3 /100 | #45 | Exceptional 48.7% |
| Immigrants | Iran | 99.2 /100 | #46 | Exceptional 48.7% |
| Northern Europeans | 99.2 /100 | #47 | Exceptional 48.7% |
| Austrians | 99.2 /100 | #48 | Exceptional 48.7% |
Demographics Similar to Cambodians by Currently Married
In terms of currently married, the demographic groups most similar to Cambodians are Zimbabwean (47.0%, a difference of 0.010%), Immigrants from Turkey (47.0%, a difference of 0.010%), Chilean (47.0%, a difference of 0.030%), Immigrants from Argentina (47.0%, a difference of 0.070%), and Immigrants from Serbia (47.0%, a difference of 0.070%).
| Demographics | Rating | Rank | Currently Married |
| Venezuelans | 74.4 /100 | #141 | Good 47.1% |
| Argentineans | 74.4 /100 | #142 | Good 47.1% |
| Guamanians/Chamorros | 74.2 /100 | #143 | Good 47.1% |
| Hmong | 73.4 /100 | #144 | Good 47.1% |
| Immigrants | South Eastern Asia | 72.9 /100 | #145 | Good 47.1% |
| Carpatho Rusyns | 72.6 /100 | #146 | Good 47.0% |
| Immigrants | Argentina | 72.0 /100 | #147 | Good 47.0% |
| Cambodians | 70.4 /100 | #148 | Good 47.0% |
| Zimbabweans | 70.1 /100 | #149 | Good 47.0% |
| Immigrants | Turkey | 70.0 /100 | #150 | Good 47.0% |
| Chileans | 69.8 /100 | #151 | Good 47.0% |
| Immigrants | Serbia | 68.8 /100 | #152 | Good 47.0% |
| Immigrants | Venezuela | 68.6 /100 | #153 | Good 47.0% |
| Albanians | 68.6 /100 | #154 | Good 47.0% |
| Arabs | 68.6 /100 | #155 | Good 47.0% |