Greek vs Lumbee Bachelor's Degree
COMPARE
Greek
Lumbee
Bachelor's Degree
Bachelor's Degree Comparison
Greeks
Lumbee
42.0%
BACHELOR'S DEGREE
99.0/ 100
METRIC RATING
89th/ 347
METRIC RANK
24.8%
BACHELOR'S DEGREE
0.0/ 100
METRIC RATING
340th/ 347
METRIC RANK
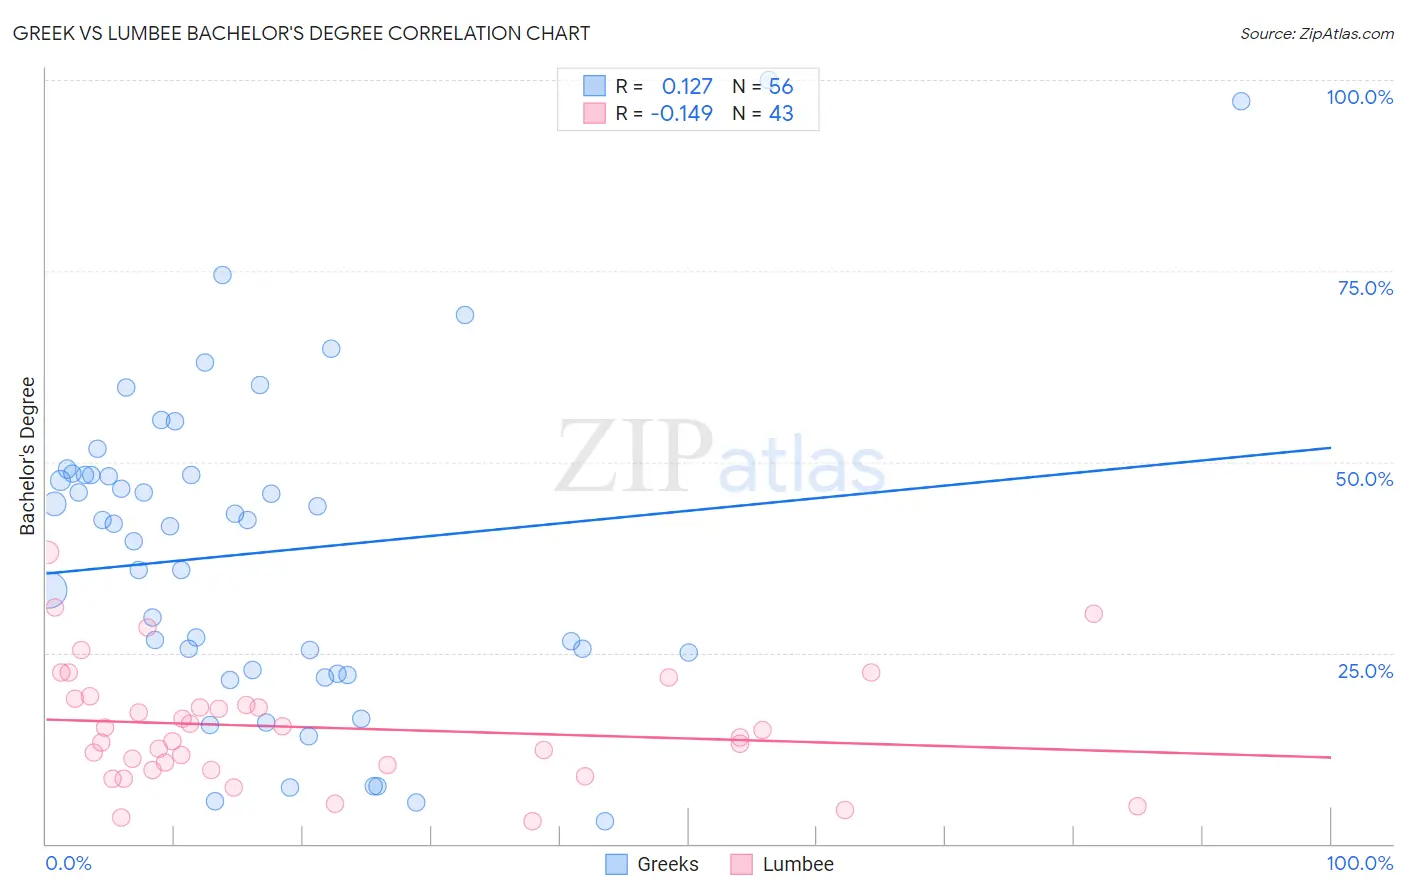
Greek vs Lumbee Bachelor's Degree Correlation Chart
The statistical analysis conducted on geographies consisting of 482,704,641 people shows a poor positive correlation between the proportion of Greeks and percentage of population with at least bachelor's degree education in the United States with a correlation coefficient (R) of 0.127 and weighted average of 42.0%. Similarly, the statistical analysis conducted on geographies consisting of 92,297,287 people shows a poor negative correlation between the proportion of Lumbee and percentage of population with at least bachelor's degree education in the United States with a correlation coefficient (R) of -0.149 and weighted average of 24.8%, a difference of 69.8%.
Bachelor's Degree Correlation Summary
| Measurement | Greek | Lumbee |
| Minimum | 2.9% | 2.9% |
| Maximum | 100.0% | 38.2% |
| Range | 97.1% | 35.2% |
| Mean | 38.2% | 15.2% |
| Median | 41.8% | 13.9% |
| Interquartile 25% (IQ1) | 22.6% | 9.7% |
| Interquartile 75% (IQ3) | 48.3% | 19.0% |
| Interquartile Range (IQR) | 25.8% | 9.2% |
| Standard Deviation (Sample) | 21.1% | 7.7% |
| Standard Deviation (Population) | 20.9% | 7.6% |
Similar Demographics by Bachelor's Degree
Demographics Similar to Greeks by Bachelor's Degree
In terms of bachelor's degree, the demographic groups most similar to Greeks are Immigrants from Western Europe (42.0%, a difference of 0.0%), Carpatho Rusyn (42.1%, a difference of 0.12%), Laotian (42.0%, a difference of 0.12%), Immigrants from Northern Africa (41.9%, a difference of 0.22%), and Maltese (41.9%, a difference of 0.30%).
| Demographics | Rating | Rank | Bachelor's Degree |
| Immigrants | Scotland | 99.2 /100 | #82 | Exceptional 42.3% |
| Armenians | 99.2 /100 | #83 | Exceptional 42.3% |
| Immigrants | Western Asia | 99.2 /100 | #84 | Exceptional 42.3% |
| Lithuanians | 99.2 /100 | #85 | Exceptional 42.2% |
| Immigrants | Brazil | 99.2 /100 | #86 | Exceptional 42.2% |
| Carpatho Rusyns | 99.0 /100 | #87 | Exceptional 42.1% |
| Immigrants | Western Europe | 99.0 /100 | #88 | Exceptional 42.0% |
| Greeks | 99.0 /100 | #89 | Exceptional 42.0% |
| Laotians | 98.9 /100 | #90 | Exceptional 42.0% |
| Immigrants | Northern Africa | 98.9 /100 | #91 | Exceptional 41.9% |
| Maltese | 98.8 /100 | #92 | Exceptional 41.9% |
| Immigrants | Canada | 98.6 /100 | #93 | Exceptional 41.7% |
| Immigrants | Nepal | 98.6 /100 | #94 | Exceptional 41.7% |
| Immigrants | North America | 98.5 /100 | #95 | Exceptional 41.7% |
| Immigrants | Moldova | 98.4 /100 | #96 | Exceptional 41.6% |
Demographics Similar to Lumbee by Bachelor's Degree
In terms of bachelor's degree, the demographic groups most similar to Lumbee are Yuman (24.5%, a difference of 0.92%), Yakama (24.5%, a difference of 1.2%), Tohono O'odham (24.4%, a difference of 1.4%), Hopi (25.3%, a difference of 2.2%), and Pueblo (25.5%, a difference of 3.2%).
| Demographics | Rating | Rank | Bachelor's Degree |
| Mexicans | 0.0 /100 | #333 | Tragic 27.1% |
| Arapaho | 0.0 /100 | #334 | Tragic 26.6% |
| Natives/Alaskans | 0.0 /100 | #335 | Tragic 26.3% |
| Immigrants | Mexico | 0.0 /100 | #336 | Tragic 26.1% |
| Inupiat | 0.0 /100 | #337 | Tragic 25.8% |
| Pueblo | 0.0 /100 | #338 | Tragic 25.5% |
| Hopi | 0.0 /100 | #339 | Tragic 25.3% |
| Lumbee | 0.0 /100 | #340 | Tragic 24.8% |
| Yuman | 0.0 /100 | #341 | Tragic 24.5% |
| Yakama | 0.0 /100 | #342 | Tragic 24.5% |
| Tohono O'odham | 0.0 /100 | #343 | Tragic 24.4% |
| Navajo | 0.0 /100 | #344 | Tragic 23.6% |
| Pima | 0.0 /100 | #345 | Tragic 23.2% |
| Houma | 0.0 /100 | #346 | Tragic 21.4% |
| Yup'ik | 0.0 /100 | #347 | Tragic 19.4% |