Greek vs Immigrants from Southern Europe Married-couple Households
COMPARE
Greek
Immigrants from Southern Europe
Married-couple Households
Married-couple Households Comparison
Greeks
Immigrants from Southern Europe
48.9%
MARRIED-COUPLE HOUSEHOLDS
99.7/ 100
METRIC RATING
38th/ 347
METRIC RANK
46.8%
MARRIED-COUPLE HOUSEHOLDS
69.9/ 100
METRIC RATING
165th/ 347
METRIC RANK
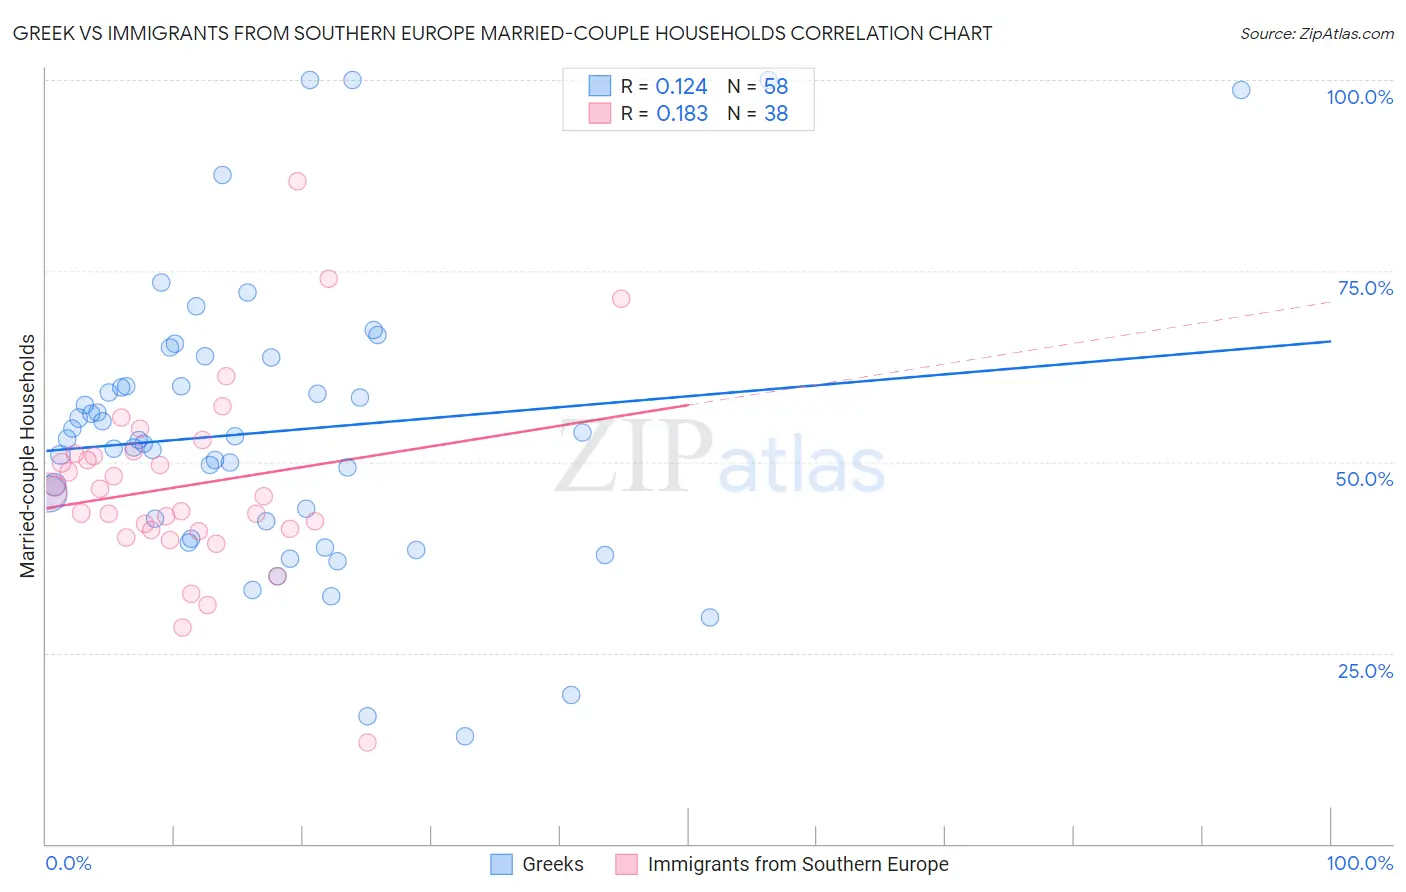
Greek vs Immigrants from Southern Europe Married-couple Households Correlation Chart
The statistical analysis conducted on geographies consisting of 482,332,211 people shows a poor positive correlation between the proportion of Greeks and percentage of married-couple family households in the United States with a correlation coefficient (R) of 0.124 and weighted average of 48.9%. Similarly, the statistical analysis conducted on geographies consisting of 402,620,740 people shows a poor positive correlation between the proportion of Immigrants from Southern Europe and percentage of married-couple family households in the United States with a correlation coefficient (R) of 0.183 and weighted average of 46.8%, a difference of 4.5%.
Married-couple Households Correlation Summary
| Measurement | Greek | Immigrants from Southern Europe |
| Minimum | 14.1% | 13.2% |
| Maximum | 100.0% | 86.8% |
| Range | 85.9% | 73.6% |
| Mean | 53.9% | 46.9% |
| Median | 53.0% | 45.8% |
| Interquartile 25% (IQ1) | 42.3% | 41.1% |
| Interquartile 75% (IQ3) | 60.0% | 51.1% |
| Interquartile Range (IQR) | 17.7% | 10.0% |
| Standard Deviation (Sample) | 18.6% | 12.7% |
| Standard Deviation (Population) | 18.5% | 12.5% |
Similar Demographics by Married-couple Households
Demographics Similar to Greeks by Married-couple Households
In terms of married-couple households, the demographic groups most similar to Greeks are Lithuanian (48.9%, a difference of 0.080%), Sri Lankan (49.0%, a difference of 0.090%), Iranian (49.0%, a difference of 0.10%), Immigrants from Bolivia (48.9%, a difference of 0.10%), and Immigrants from Lebanon (48.9%, a difference of 0.13%).
| Demographics | Rating | Rank | Married-couple Households |
| Native Hawaiians | 99.8 /100 | #31 | Exceptional 49.1% |
| Hungarians | 99.8 /100 | #32 | Exceptional 49.1% |
| Immigrants | Asia | 99.7 /100 | #33 | Exceptional 49.1% |
| Italians | 99.7 /100 | #34 | Exceptional 49.0% |
| Scottish | 99.7 /100 | #35 | Exceptional 49.0% |
| Iranians | 99.7 /100 | #36 | Exceptional 49.0% |
| Sri Lankans | 99.7 /100 | #37 | Exceptional 49.0% |
| Greeks | 99.7 /100 | #38 | Exceptional 48.9% |
| Lithuanians | 99.6 /100 | #39 | Exceptional 48.9% |
| Immigrants | Bolivia | 99.6 /100 | #40 | Exceptional 48.9% |
| Immigrants | Lebanon | 99.6 /100 | #41 | Exceptional 48.9% |
| Immigrants | Vietnam | 99.6 /100 | #42 | Exceptional 48.8% |
| Immigrants | Iran | 99.6 /100 | #43 | Exceptional 48.8% |
| Welsh | 99.5 /100 | #44 | Exceptional 48.8% |
| Immigrants | Eastern Asia | 99.5 /100 | #45 | Exceptional 48.8% |
Demographics Similar to Immigrants from Southern Europe by Married-couple Households
In terms of married-couple households, the demographic groups most similar to Immigrants from Southern Europe are Immigrants from Kazakhstan (46.8%, a difference of 0.0%), Immigrants from Turkey (46.8%, a difference of 0.010%), Colombian (46.8%, a difference of 0.050%), Delaware (46.8%, a difference of 0.060%), and Iraqi (46.9%, a difference of 0.080%).
| Demographics | Rating | Rank | Married-couple Households |
| Immigrants | Nonimmigrants | 73.3 /100 | #158 | Good 46.9% |
| Osage | 73.2 /100 | #159 | Good 46.9% |
| Iraqis | 71.7 /100 | #160 | Good 46.9% |
| Delaware | 71.2 /100 | #161 | Good 46.8% |
| Colombians | 71.0 /100 | #162 | Good 46.8% |
| Immigrants | Turkey | 70.2 /100 | #163 | Good 46.8% |
| Immigrants | Kazakhstan | 70.0 /100 | #164 | Good 46.8% |
| Immigrants | Southern Europe | 69.9 /100 | #165 | Good 46.8% |
| Cherokee | 65.7 /100 | #166 | Good 46.7% |
| Immigrants | Croatia | 64.2 /100 | #167 | Good 46.7% |
| Israelis | 62.3 /100 | #168 | Good 46.7% |
| Spanish American Indians | 59.4 /100 | #169 | Average 46.6% |
| South Americans | 58.0 /100 | #170 | Average 46.6% |
| Immigrants | Chile | 55.7 /100 | #171 | Average 46.5% |
| Immigrants | Australia | 54.6 /100 | #172 | Average 46.5% |