Greek vs Immigrants from Ethiopia Married-couple Households
COMPARE
Greek
Immigrants from Ethiopia
Married-couple Households
Married-couple Households Comparison
Greeks
Immigrants from Ethiopia
48.9%
MARRIED-COUPLE HOUSEHOLDS
99.7/ 100
METRIC RATING
38th/ 347
METRIC RANK
43.1%
MARRIED-COUPLE HOUSEHOLDS
0.0/ 100
METRIC RATING
276th/ 347
METRIC RANK
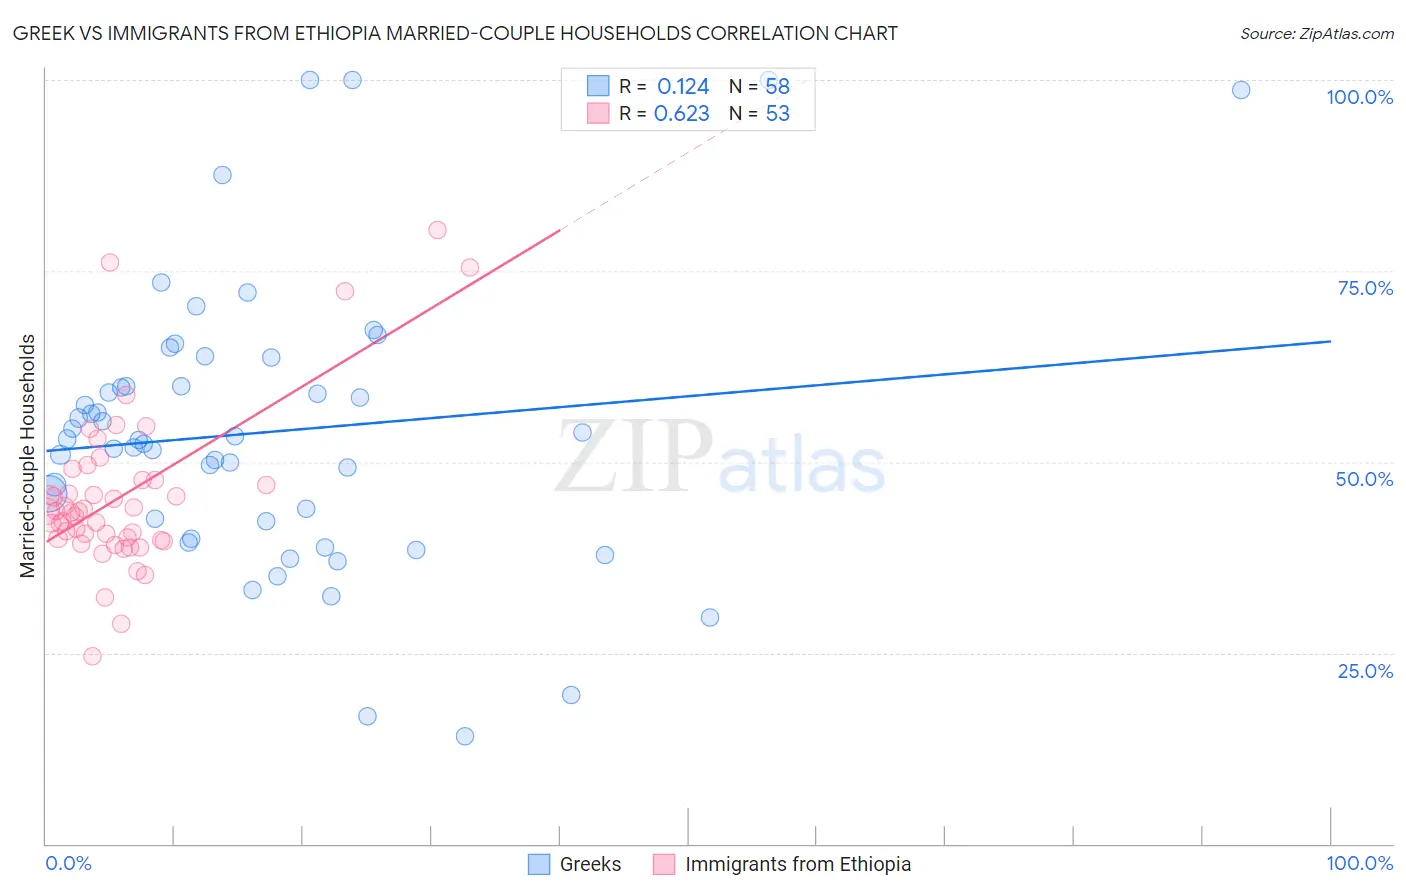
Greek vs Immigrants from Ethiopia Married-couple Households Correlation Chart
The statistical analysis conducted on geographies consisting of 482,332,211 people shows a poor positive correlation between the proportion of Greeks and percentage of married-couple family households in the United States with a correlation coefficient (R) of 0.124 and weighted average of 48.9%. Similarly, the statistical analysis conducted on geographies consisting of 211,463,279 people shows a significant positive correlation between the proportion of Immigrants from Ethiopia and percentage of married-couple family households in the United States with a correlation coefficient (R) of 0.623 and weighted average of 43.1%, a difference of 13.6%.
Married-couple Households Correlation Summary
| Measurement | Greek | Immigrants from Ethiopia |
| Minimum | 14.1% | 24.6% |
| Maximum | 100.0% | 80.4% |
| Range | 85.9% | 55.7% |
| Mean | 53.9% | 45.5% |
| Median | 53.0% | 43.5% |
| Interquartile 25% (IQ1) | 42.3% | 39.9% |
| Interquartile 75% (IQ3) | 60.0% | 47.7% |
| Interquartile Range (IQR) | 17.7% | 7.8% |
| Standard Deviation (Sample) | 18.6% | 10.7% |
| Standard Deviation (Population) | 18.5% | 10.6% |
Similar Demographics by Married-couple Households
Demographics Similar to Greeks by Married-couple Households
In terms of married-couple households, the demographic groups most similar to Greeks are Lithuanian (48.9%, a difference of 0.080%), Sri Lankan (49.0%, a difference of 0.090%), Iranian (49.0%, a difference of 0.10%), Immigrants from Bolivia (48.9%, a difference of 0.10%), and Immigrants from Lebanon (48.9%, a difference of 0.13%).
| Demographics | Rating | Rank | Married-couple Households |
| Native Hawaiians | 99.8 /100 | #31 | Exceptional 49.1% |
| Hungarians | 99.8 /100 | #32 | Exceptional 49.1% |
| Immigrants | Asia | 99.7 /100 | #33 | Exceptional 49.1% |
| Italians | 99.7 /100 | #34 | Exceptional 49.0% |
| Scottish | 99.7 /100 | #35 | Exceptional 49.0% |
| Iranians | 99.7 /100 | #36 | Exceptional 49.0% |
| Sri Lankans | 99.7 /100 | #37 | Exceptional 49.0% |
| Greeks | 99.7 /100 | #38 | Exceptional 48.9% |
| Lithuanians | 99.6 /100 | #39 | Exceptional 48.9% |
| Immigrants | Bolivia | 99.6 /100 | #40 | Exceptional 48.9% |
| Immigrants | Lebanon | 99.6 /100 | #41 | Exceptional 48.9% |
| Immigrants | Vietnam | 99.6 /100 | #42 | Exceptional 48.8% |
| Immigrants | Iran | 99.6 /100 | #43 | Exceptional 48.8% |
| Welsh | 99.5 /100 | #44 | Exceptional 48.8% |
| Immigrants | Eastern Asia | 99.5 /100 | #45 | Exceptional 48.8% |
Demographics Similar to Immigrants from Ethiopia by Married-couple Households
In terms of married-couple households, the demographic groups most similar to Immigrants from Ethiopia are Immigrants from Bangladesh (43.1%, a difference of 0.11%), Nigerian (43.2%, a difference of 0.25%), Ethiopian (43.2%, a difference of 0.26%), Immigrants from Eastern Africa (42.9%, a difference of 0.26%), and Immigrants from Nigeria (43.2%, a difference of 0.36%).
| Demographics | Rating | Rank | Married-couple Households |
| Immigrants | Sierra Leone | 0.1 /100 | #269 | Tragic 43.3% |
| Yuman | 0.1 /100 | #270 | Tragic 43.3% |
| Guatemalans | 0.1 /100 | #271 | Tragic 43.3% |
| Immigrants | Nigeria | 0.1 /100 | #272 | Tragic 43.2% |
| Ethiopians | 0.1 /100 | #273 | Tragic 43.2% |
| Nigerians | 0.1 /100 | #274 | Tragic 43.2% |
| Immigrants | Bangladesh | 0.0 /100 | #275 | Tragic 43.1% |
| Immigrants | Ethiopia | 0.0 /100 | #276 | Tragic 43.1% |
| Immigrants | Eastern Africa | 0.0 /100 | #277 | Tragic 42.9% |
| Immigrants | Africa | 0.0 /100 | #278 | Tragic 42.9% |
| Sierra Leoneans | 0.0 /100 | #279 | Tragic 42.9% |
| Immigrants | Ecuador | 0.0 /100 | #280 | Tragic 42.9% |
| Immigrants | Guatemala | 0.0 /100 | #281 | Tragic 42.8% |
| Bermudans | 0.0 /100 | #282 | Tragic 42.4% |
| Inupiat | 0.0 /100 | #283 | Tragic 42.4% |