Afghan vs Mongolian Average Family Size
COMPARE
Afghan
Mongolian
Average Family Size
Average Family Size Comparison
Afghans
Mongolians
3.31
AVERAGE FAMILY SIZE
99.7/ 100
METRIC RATING
85th/ 347
METRIC RANK
3.20
AVERAGE FAMILY SIZE
11.5/ 100
METRIC RATING
213th/ 347
METRIC RANK
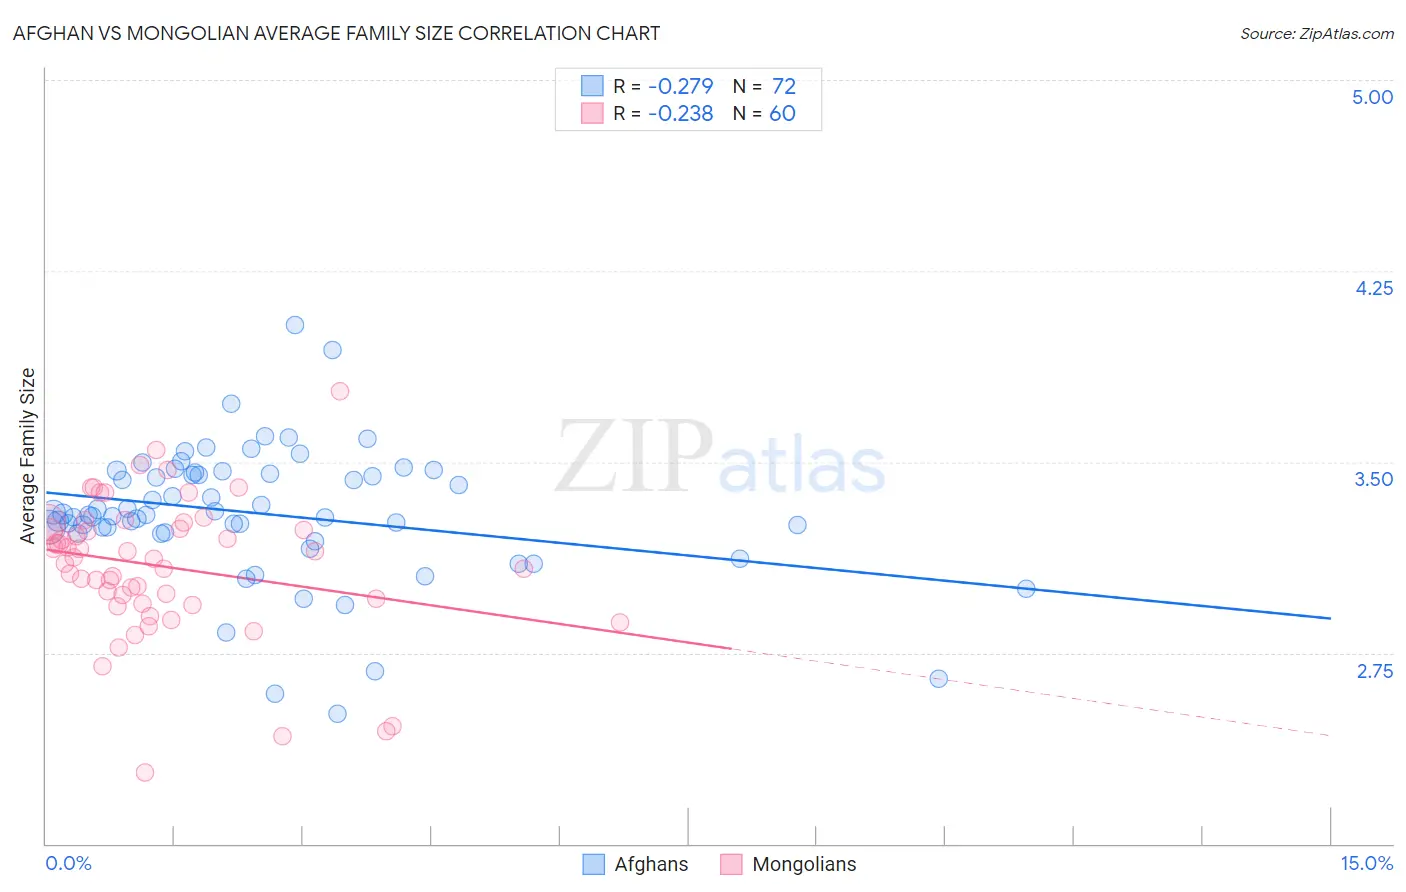
Afghan vs Mongolian Average Family Size Correlation Chart
The statistical analysis conducted on geographies consisting of 148,832,546 people shows a weak negative correlation between the proportion of Afghans and average family size in the United States with a correlation coefficient (R) of -0.279 and weighted average of 3.31. Similarly, the statistical analysis conducted on geographies consisting of 140,294,532 people shows a weak negative correlation between the proportion of Mongolians and average family size in the United States with a correlation coefficient (R) of -0.238 and weighted average of 3.20, a difference of 3.6%.
Average Family Size Correlation Summary
| Measurement | Afghan | Mongolian |
| Minimum | 2.51 | 2.28 |
| Maximum | 4.04 | 3.78 |
| Range | 1.53 | 1.50 |
| Mean | 3.30 | 3.09 |
| Median | 3.29 | 3.12 |
| Interquartile 25% (IQ1) | 3.22 | 2.95 |
| Interquartile 75% (IQ3) | 3.46 | 3.25 |
| Interquartile Range (IQR) | 0.23 | 0.30 |
| Standard Deviation (Sample) | 0.26 | 0.28 |
| Standard Deviation (Population) | 0.26 | 0.27 |
Similar Demographics by Average Family Size
Demographics Similar to Afghans by Average Family Size
In terms of average family size, the demographic groups most similar to Afghans are Jamaican (3.31, a difference of 0.020%), Immigrants from Nigeria (3.32, a difference of 0.040%), Immigrants from Peru (3.31, a difference of 0.070%), Immigrants from Afghanistan (3.32, a difference of 0.080%), and Ecuadorian (3.32, a difference of 0.090%).
| Demographics | Rating | Rank | Average Family Size |
| Immigrants | Micronesia | 99.8 /100 | #78 | Exceptional 3.32 |
| British West Indians | 99.8 /100 | #79 | Exceptional 3.32 |
| Lumbee | 99.8 /100 | #80 | Exceptional 3.32 |
| Immigrants | Dominica | 99.8 /100 | #81 | Exceptional 3.32 |
| Ecuadorians | 99.8 /100 | #82 | Exceptional 3.32 |
| Immigrants | Afghanistan | 99.8 /100 | #83 | Exceptional 3.32 |
| Immigrants | Nigeria | 99.7 /100 | #84 | Exceptional 3.32 |
| Afghans | 99.7 /100 | #85 | Exceptional 3.31 |
| Jamaicans | 99.7 /100 | #86 | Exceptional 3.31 |
| Immigrants | Peru | 99.7 /100 | #87 | Exceptional 3.31 |
| Immigrants | Bolivia | 99.6 /100 | #88 | Exceptional 3.31 |
| Malaysians | 99.6 /100 | #89 | Exceptional 3.31 |
| Menominee | 99.4 /100 | #90 | Exceptional 3.30 |
| Immigrants | Pakistan | 99.2 /100 | #91 | Exceptional 3.30 |
| Immigrants | Cameroon | 99.2 /100 | #92 | Exceptional 3.30 |
Demographics Similar to Mongolians by Average Family Size
In terms of average family size, the demographic groups most similar to Mongolians are Immigrants from Iran (3.20, a difference of 0.020%), Creek (3.20, a difference of 0.020%), Somali (3.20, a difference of 0.020%), Delaware (3.20, a difference of 0.020%), and Bermudan (3.20, a difference of 0.030%).
| Demographics | Rating | Rank | Average Family Size |
| Immigrants | Cabo Verde | 16.0 /100 | #206 | Poor 3.20 |
| Filipinos | 13.6 /100 | #207 | Poor 3.20 |
| Chippewa | 13.3 /100 | #208 | Poor 3.20 |
| Sudanese | 13.3 /100 | #209 | Poor 3.20 |
| Zimbabweans | 12.6 /100 | #210 | Poor 3.20 |
| Immigrants | Iran | 12.1 /100 | #211 | Poor 3.20 |
| Creek | 12.1 /100 | #212 | Poor 3.20 |
| Mongolians | 11.5 /100 | #213 | Poor 3.20 |
| Somalis | 11.2 /100 | #214 | Poor 3.20 |
| Delaware | 11.1 /100 | #215 | Poor 3.20 |
| Bermudans | 11.0 /100 | #216 | Poor 3.20 |
| Immigrants | Somalia | 10.3 /100 | #217 | Poor 3.20 |
| French American Indians | 9.8 /100 | #218 | Tragic 3.20 |
| Pennsylvania Germans | 9.3 /100 | #219 | Tragic 3.19 |
| Lebanese | 9.1 /100 | #220 | Tragic 3.19 |