German Russian vs Panamanian Births to Unmarried Women
COMPARE
German Russian
Panamanian
Births to Unmarried Women
Births to Unmarried Women Comparison
German Russians
Panamanians
33.1%
BIRTHS TO UNMARRIED WOMEN
13.1/ 100
METRIC RATING
205th/ 347
METRIC RANK
34.2%
BIRTHS TO UNMARRIED WOMEN
3.3/ 100
METRIC RATING
228th/ 347
METRIC RANK
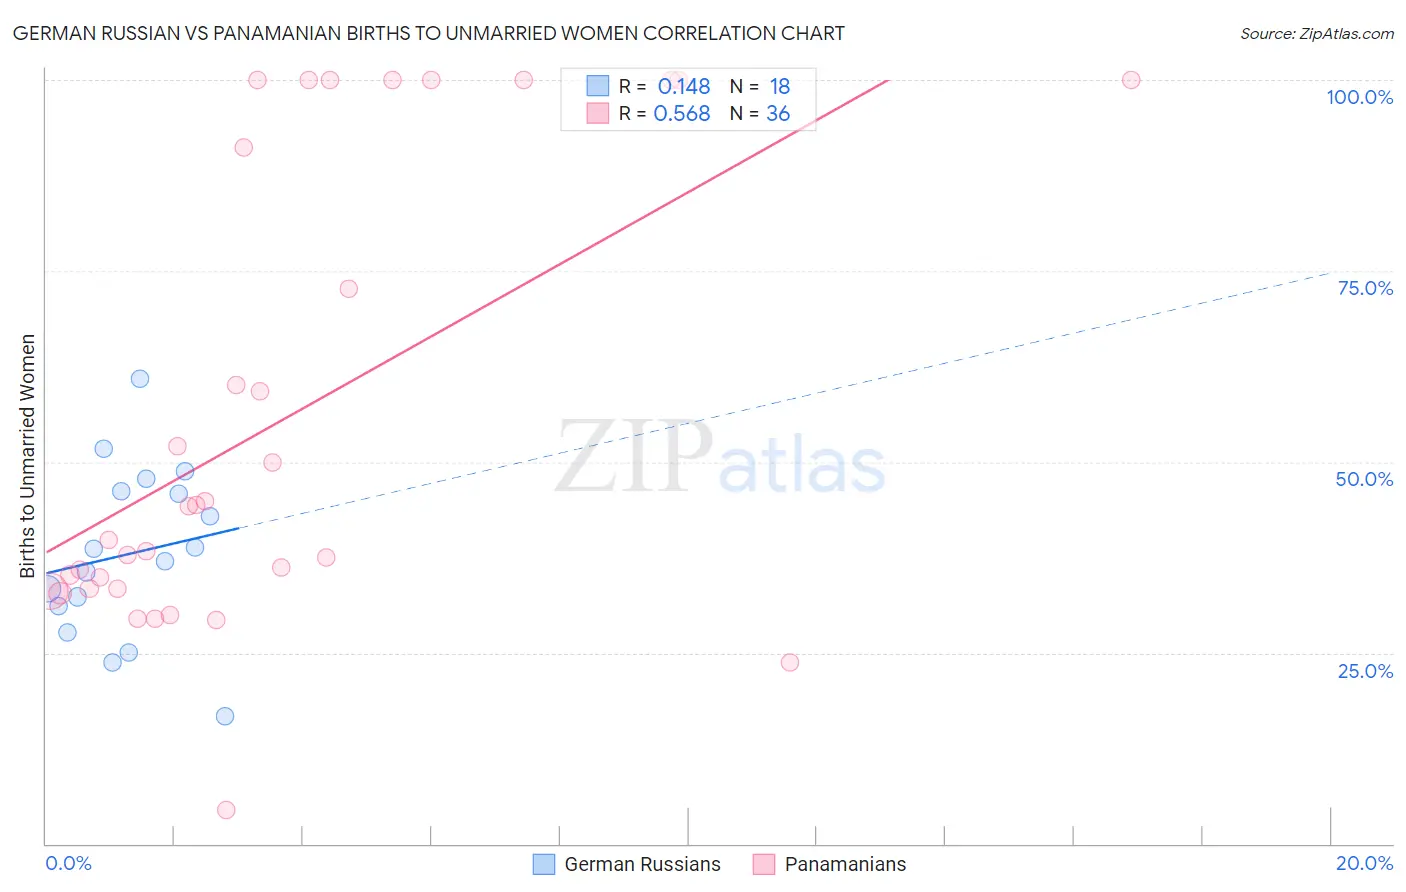
German Russian vs Panamanian Births to Unmarried Women Correlation Chart
The statistical analysis conducted on geographies consisting of 94,648,089 people shows a poor positive correlation between the proportion of German Russians and percentage of births to unmarried women in the United States with a correlation coefficient (R) of 0.148 and weighted average of 33.1%. Similarly, the statistical analysis conducted on geographies consisting of 269,712,118 people shows a substantial positive correlation between the proportion of Panamanians and percentage of births to unmarried women in the United States with a correlation coefficient (R) of 0.568 and weighted average of 34.2%, a difference of 3.4%.
Births to Unmarried Women Correlation Summary
| Measurement | German Russian | Panamanian |
| Minimum | 16.7% | 4.5% |
| Maximum | 60.9% | 100.0% |
| Range | 44.2% | 95.5% |
| Mean | 38.0% | 55.4% |
| Median | 37.8% | 42.0% |
| Interquartile 25% (IQ1) | 31.1% | 33.4% |
| Interquartile 75% (IQ3) | 46.1% | 95.6% |
| Interquartile Range (IQR) | 15.1% | 62.2% |
| Standard Deviation (Sample) | 11.2% | 29.7% |
| Standard Deviation (Population) | 10.8% | 29.3% |
Similar Demographics by Births to Unmarried Women
Demographics Similar to German Russians by Births to Unmarried Women
In terms of births to unmarried women, the demographic groups most similar to German Russians are Uruguayan (33.1%, a difference of 0.060%), Immigrants from Africa (33.0%, a difference of 0.23%), Ute (33.0%, a difference of 0.25%), Immigrants from Sudan (33.2%, a difference of 0.34%), and Hawaiian (33.2%, a difference of 0.38%).
| Demographics | Rating | Rank | Births to Unmarried Women |
| Costa Ricans | 20.3 /100 | #198 | Fair 32.7% |
| Immigrants | Thailand | 18.9 /100 | #199 | Poor 32.8% |
| Immigrants | Germany | 18.8 /100 | #200 | Poor 32.8% |
| Immigrants | Burma/Myanmar | 16.7 /100 | #201 | Poor 32.9% |
| Immigrants | Micronesia | 16.6 /100 | #202 | Poor 32.9% |
| Ute | 14.4 /100 | #203 | Poor 33.0% |
| Immigrants | Africa | 14.3 /100 | #204 | Poor 33.0% |
| German Russians | 13.1 /100 | #205 | Poor 33.1% |
| Uruguayans | 12.8 /100 | #206 | Poor 33.1% |
| Immigrants | Sudan | 11.5 /100 | #207 | Poor 33.2% |
| Hawaiians | 11.3 /100 | #208 | Poor 33.2% |
| Whites/Caucasians | 10.7 /100 | #209 | Poor 33.3% |
| Scotch-Irish | 10.7 /100 | #210 | Poor 33.3% |
| Ecuadorians | 10.5 /100 | #211 | Poor 33.3% |
| Celtics | 10.2 /100 | #212 | Poor 33.3% |
Demographics Similar to Panamanians by Births to Unmarried Women
In terms of births to unmarried women, the demographic groups most similar to Panamanians are Immigrants from Panama (34.2%, a difference of 0.030%), Delaware (34.2%, a difference of 0.050%), Immigrants from Sierra Leone (34.2%, a difference of 0.11%), Ghanaian (34.3%, a difference of 0.13%), and Native Hawaiian (34.3%, a difference of 0.28%).
| Demographics | Rating | Rank | Births to Unmarried Women |
| Malaysians | 5.0 /100 | #221 | Tragic 33.9% |
| Immigrants | Uruguay | 4.8 /100 | #222 | Tragic 33.9% |
| Pennsylvania Germans | 4.3 /100 | #223 | Tragic 34.0% |
| Immigrants | Laos | 4.3 /100 | #224 | Tragic 34.0% |
| Spanish | 4.0 /100 | #225 | Tragic 34.1% |
| Delaware | 3.3 /100 | #226 | Tragic 34.2% |
| Immigrants | Panama | 3.3 /100 | #227 | Tragic 34.2% |
| Panamanians | 3.3 /100 | #228 | Tragic 34.2% |
| Immigrants | Sierra Leone | 3.1 /100 | #229 | Tragic 34.2% |
| Ghanaians | 3.1 /100 | #230 | Tragic 34.3% |
| Native Hawaiians | 2.9 /100 | #231 | Tragic 34.3% |
| French Canadians | 2.5 /100 | #232 | Tragic 34.4% |
| Bangladeshis | 2.5 /100 | #233 | Tragic 34.4% |
| Immigrants | Zaire | 2.3 /100 | #234 | Tragic 34.5% |
| Immigrants | Ghana | 2.2 /100 | #235 | Tragic 34.5% |