Nonimmigrants vs Panamanian Births to Unmarried Women
COMPARE
Nonimmigrants
Panamanian
Births to Unmarried Women
Births to Unmarried Women Comparison
Nonimmigrants
Panamanians
35.5%
BIRTHS TO UNMARRIED WOMEN
0.6/ 100
METRIC RATING
248th/ 347
METRIC RANK
34.2%
BIRTHS TO UNMARRIED WOMEN
3.3/ 100
METRIC RATING
228th/ 347
METRIC RANK
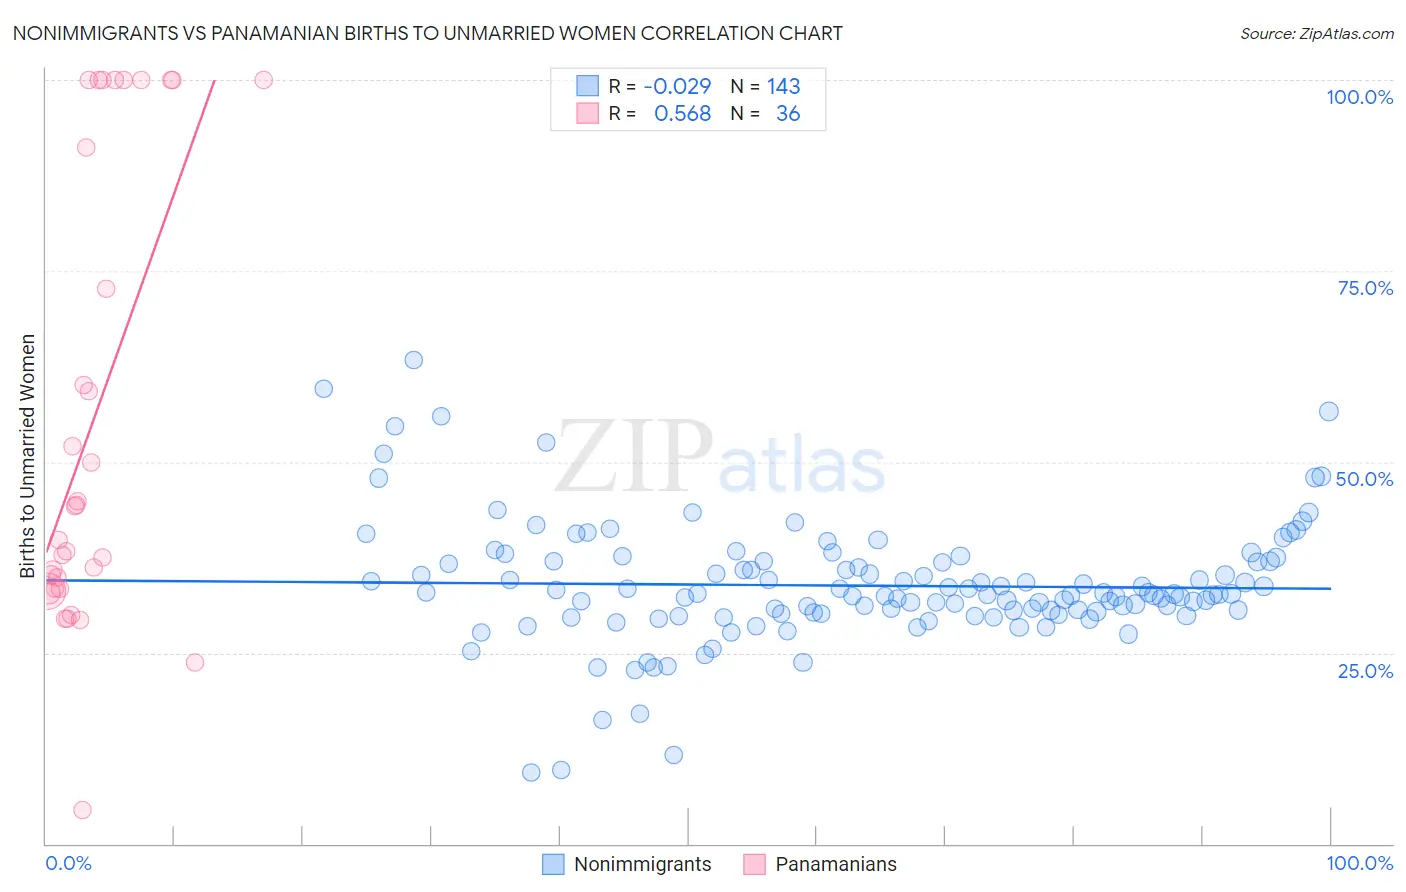
Nonimmigrants vs Panamanian Births to Unmarried Women Correlation Chart
The statistical analysis conducted on geographies consisting of 513,664,805 people shows no correlation between the proportion of Nonimmigrants and percentage of births to unmarried women in the United States with a correlation coefficient (R) of -0.029 and weighted average of 35.5%. Similarly, the statistical analysis conducted on geographies consisting of 269,712,118 people shows a substantial positive correlation between the proportion of Panamanians and percentage of births to unmarried women in the United States with a correlation coefficient (R) of 0.568 and weighted average of 34.2%, a difference of 3.9%.
Births to Unmarried Women Correlation Summary
| Measurement | Nonimmigrants | Panamanian |
| Minimum | 9.4% | 4.5% |
| Maximum | 63.3% | 100.0% |
| Range | 53.9% | 95.5% |
| Mean | 33.8% | 55.4% |
| Median | 32.6% | 42.0% |
| Interquartile 25% (IQ1) | 30.2% | 33.4% |
| Interquartile 75% (IQ3) | 37.0% | 95.6% |
| Interquartile Range (IQR) | 6.8% | 62.2% |
| Standard Deviation (Sample) | 8.1% | 29.7% |
| Standard Deviation (Population) | 8.0% | 29.3% |
Demographics Similar to Nonimmigrants and Panamanians by Births to Unmarried Women
In terms of births to unmarried women, the demographic groups most similar to Nonimmigrants are Immigrants from Nigeria (35.4%, a difference of 0.33%), Nigerian (35.3%, a difference of 0.54%), Shoshone (35.3%, a difference of 0.65%), Guyanese (35.2%, a difference of 0.99%), and Japanese (35.2%, a difference of 1.1%). Similarly, the demographic groups most similar to Panamanians are Immigrants from Sierra Leone (34.2%, a difference of 0.11%), Ghanaian (34.3%, a difference of 0.13%), Native Hawaiian (34.3%, a difference of 0.28%), French Canadian (34.4%, a difference of 0.58%), and Bangladeshi (34.4%, a difference of 0.59%).
| Demographics | Rating | Rank | Births to Unmarried Women |
| Panamanians | 3.3 /100 | #228 | Tragic 34.2% |
| Immigrants | Sierra Leone | 3.1 /100 | #229 | Tragic 34.2% |
| Ghanaians | 3.1 /100 | #230 | Tragic 34.3% |
| Native Hawaiians | 2.9 /100 | #231 | Tragic 34.3% |
| French Canadians | 2.5 /100 | #232 | Tragic 34.4% |
| Bangladeshis | 2.5 /100 | #233 | Tragic 34.4% |
| Immigrants | Zaire | 2.3 /100 | #234 | Tragic 34.5% |
| Immigrants | Ghana | 2.2 /100 | #235 | Tragic 34.5% |
| Immigrants | Cameroon | 1.6 /100 | #236 | Tragic 34.7% |
| Marshallese | 1.6 /100 | #237 | Tragic 34.8% |
| Immigrants | Cambodia | 1.6 /100 | #238 | Tragic 34.8% |
| Sierra Leoneans | 1.4 /100 | #239 | Tragic 34.9% |
| Immigrants | Middle Africa | 1.2 /100 | #240 | Tragic 34.9% |
| Immigrants | Guyana | 1.2 /100 | #241 | Tragic 35.0% |
| Indonesians | 1.2 /100 | #242 | Tragic 35.0% |
| Japanese | 0.9 /100 | #243 | Tragic 35.2% |
| Guyanese | 0.9 /100 | #244 | Tragic 35.2% |
| Shoshone | 0.8 /100 | #245 | Tragic 35.3% |
| Nigerians | 0.7 /100 | #246 | Tragic 35.3% |
| Immigrants | Nigeria | 0.7 /100 | #247 | Tragic 35.4% |
| Immigrants | Nonimmigrants | 0.6 /100 | #248 | Tragic 35.5% |