Carpatho Rusyn vs Panamanian Births to Unmarried Women
COMPARE
Carpatho Rusyn
Panamanian
Births to Unmarried Women
Births to Unmarried Women Comparison
Carpatho Rusyns
Panamanians
30.9%
BIRTHS TO UNMARRIED WOMEN
73.5/ 100
METRIC RATING
156th/ 347
METRIC RANK
34.2%
BIRTHS TO UNMARRIED WOMEN
3.3/ 100
METRIC RATING
228th/ 347
METRIC RANK
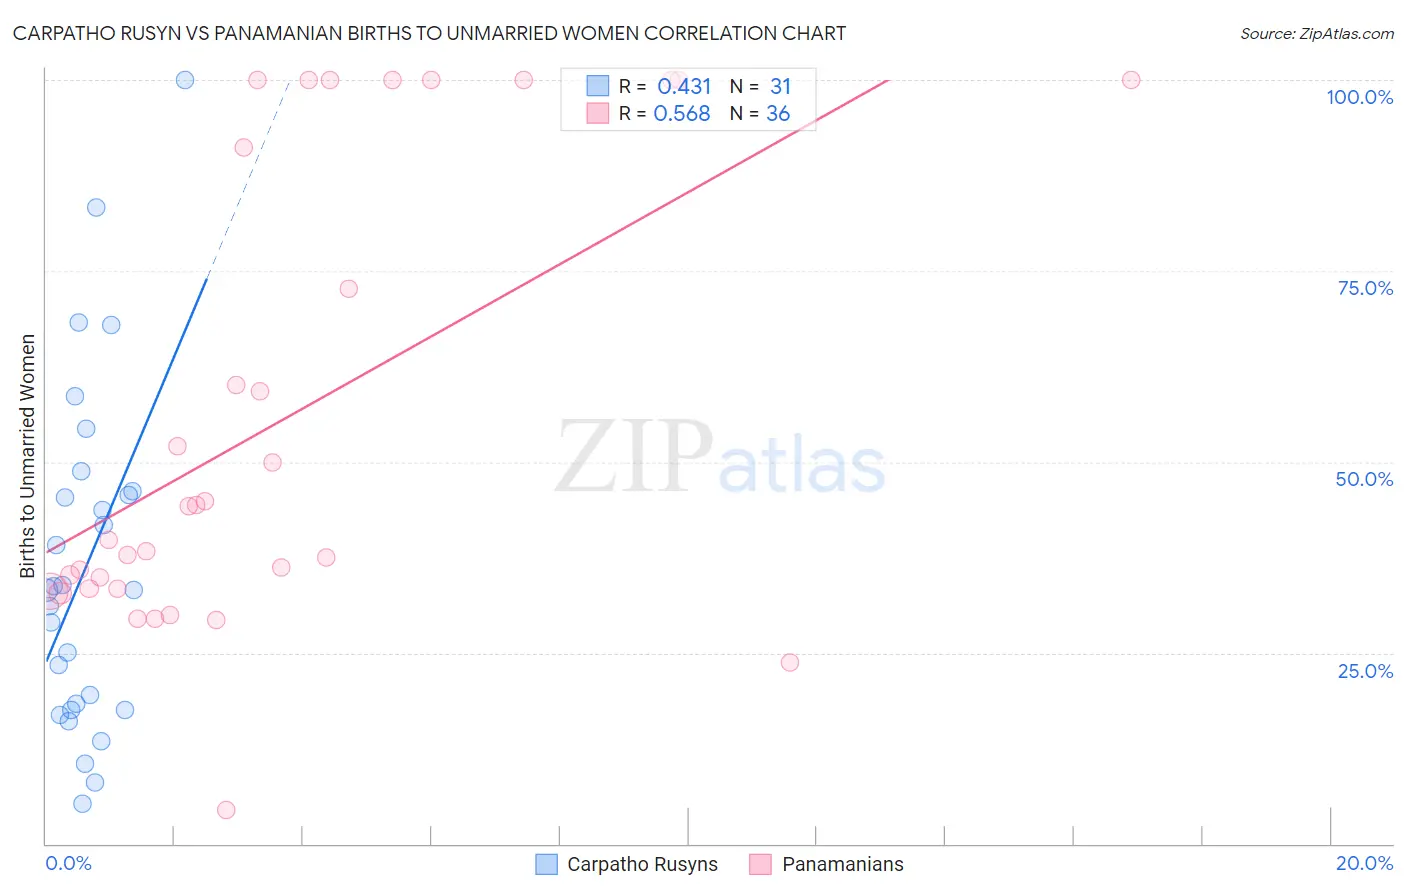
Carpatho Rusyn vs Panamanian Births to Unmarried Women Correlation Chart
The statistical analysis conducted on geographies consisting of 56,982,210 people shows a moderate positive correlation between the proportion of Carpatho Rusyns and percentage of births to unmarried women in the United States with a correlation coefficient (R) of 0.431 and weighted average of 30.9%. Similarly, the statistical analysis conducted on geographies consisting of 269,712,118 people shows a substantial positive correlation between the proportion of Panamanians and percentage of births to unmarried women in the United States with a correlation coefficient (R) of 0.568 and weighted average of 34.2%, a difference of 10.7%.
Births to Unmarried Women Correlation Summary
| Measurement | Carpatho Rusyn | Panamanian |
| Minimum | 5.2% | 4.5% |
| Maximum | 100.0% | 100.0% |
| Range | 94.8% | 95.5% |
| Mean | 36.4% | 55.4% |
| Median | 33.3% | 42.0% |
| Interquartile 25% (IQ1) | 17.5% | 33.4% |
| Interquartile 75% (IQ3) | 46.2% | 95.6% |
| Interquartile Range (IQR) | 28.7% | 62.2% |
| Standard Deviation (Sample) | 22.4% | 29.7% |
| Standard Deviation (Population) | 22.1% | 29.3% |
Similar Demographics by Births to Unmarried Women
Demographics Similar to Carpatho Rusyns by Births to Unmarried Women
In terms of births to unmarried women, the demographic groups most similar to Carpatho Rusyns are Immigrants from Bangladesh (30.9%, a difference of 0.050%), Immigrants from Eastern Africa (31.0%, a difference of 0.17%), Yugoslavian (30.8%, a difference of 0.20%), British (30.8%, a difference of 0.32%), and Polish (30.8%, a difference of 0.34%).
| Demographics | Rating | Rank | Births to Unmarried Women |
| Serbians | 78.8 /100 | #149 | Good 30.7% |
| Somalis | 77.8 /100 | #150 | Good 30.7% |
| Italians | 77.0 /100 | #151 | Good 30.8% |
| Poles | 76.2 /100 | #152 | Good 30.8% |
| British | 76.0 /100 | #153 | Good 30.8% |
| Yugoslavians | 75.1 /100 | #154 | Good 30.8% |
| Immigrants | Bangladesh | 73.9 /100 | #155 | Good 30.9% |
| Carpatho Rusyns | 73.5 /100 | #156 | Good 30.9% |
| Immigrants | Eastern Africa | 72.1 /100 | #157 | Good 31.0% |
| Austrians | 69.9 /100 | #158 | Good 31.0% |
| Immigrants | England | 69.4 /100 | #159 | Good 31.1% |
| Immigrants | Western Europe | 69.3 /100 | #160 | Good 31.1% |
| Immigrants | Southern Europe | 68.7 /100 | #161 | Good 31.1% |
| Slovenes | 65.9 /100 | #162 | Good 31.2% |
| Immigrants | Chile | 65.7 /100 | #163 | Good 31.2% |
Demographics Similar to Panamanians by Births to Unmarried Women
In terms of births to unmarried women, the demographic groups most similar to Panamanians are Immigrants from Panama (34.2%, a difference of 0.030%), Delaware (34.2%, a difference of 0.050%), Immigrants from Sierra Leone (34.2%, a difference of 0.11%), Ghanaian (34.3%, a difference of 0.13%), and Native Hawaiian (34.3%, a difference of 0.28%).
| Demographics | Rating | Rank | Births to Unmarried Women |
| Malaysians | 5.0 /100 | #221 | Tragic 33.9% |
| Immigrants | Uruguay | 4.8 /100 | #222 | Tragic 33.9% |
| Pennsylvania Germans | 4.3 /100 | #223 | Tragic 34.0% |
| Immigrants | Laos | 4.3 /100 | #224 | Tragic 34.0% |
| Spanish | 4.0 /100 | #225 | Tragic 34.1% |
| Delaware | 3.3 /100 | #226 | Tragic 34.2% |
| Immigrants | Panama | 3.3 /100 | #227 | Tragic 34.2% |
| Panamanians | 3.3 /100 | #228 | Tragic 34.2% |
| Immigrants | Sierra Leone | 3.1 /100 | #229 | Tragic 34.2% |
| Ghanaians | 3.1 /100 | #230 | Tragic 34.3% |
| Native Hawaiians | 2.9 /100 | #231 | Tragic 34.3% |
| French Canadians | 2.5 /100 | #232 | Tragic 34.4% |
| Bangladeshis | 2.5 /100 | #233 | Tragic 34.4% |
| Immigrants | Zaire | 2.3 /100 | #234 | Tragic 34.5% |
| Immigrants | Ghana | 2.2 /100 | #235 | Tragic 34.5% |