English vs Panamanian Births to Unmarried Women
COMPARE
English
Panamanian
Births to Unmarried Women
Births to Unmarried Women Comparison
English
Panamanians
31.7%
BIRTHS TO UNMARRIED WOMEN
47.4/ 100
METRIC RATING
178th/ 347
METRIC RANK
34.2%
BIRTHS TO UNMARRIED WOMEN
3.3/ 100
METRIC RATING
228th/ 347
METRIC RANK
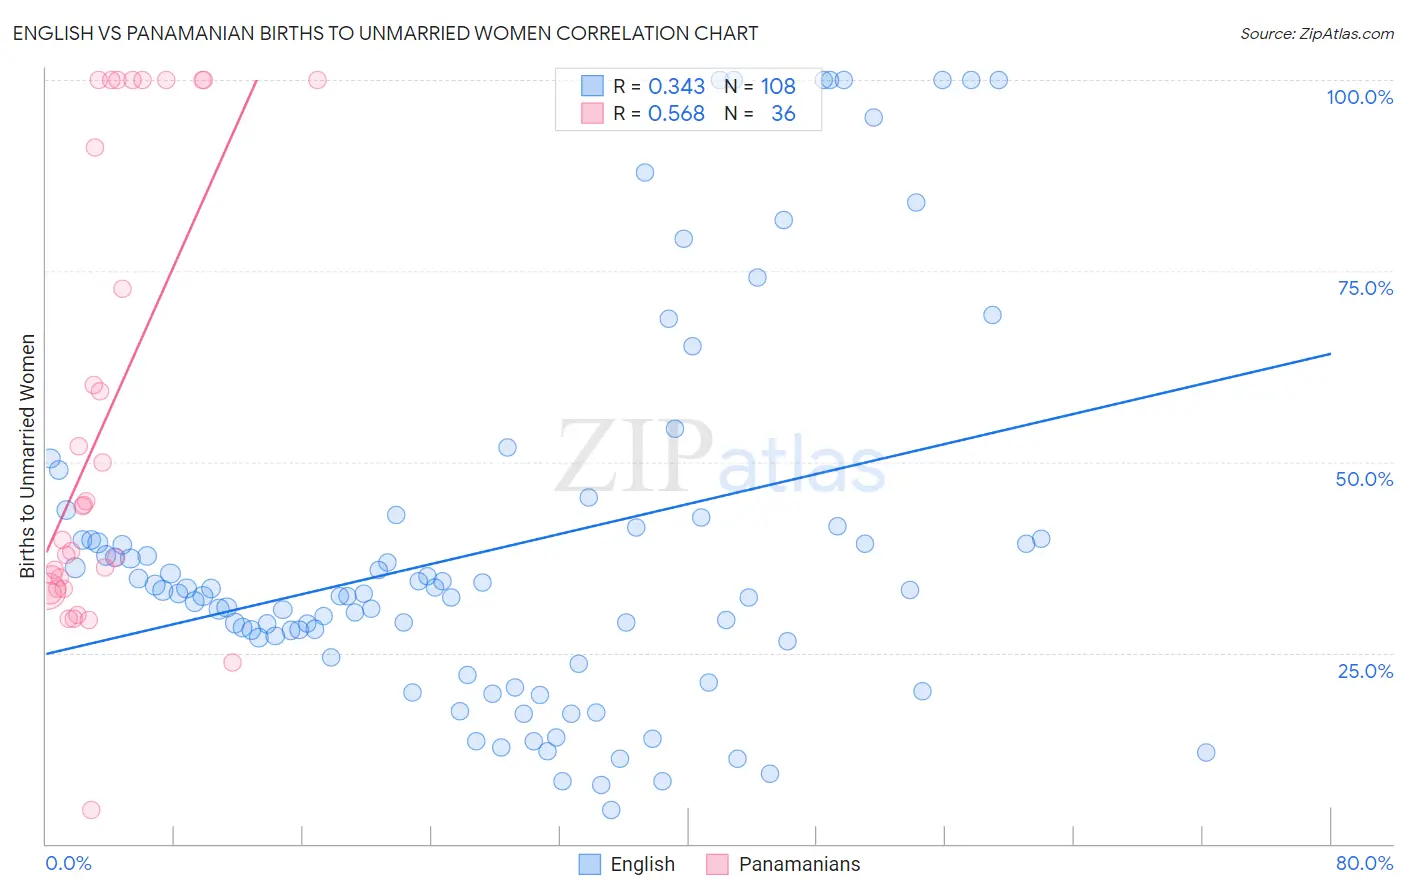
English vs Panamanian Births to Unmarried Women Correlation Chart
The statistical analysis conducted on geographies consisting of 509,798,956 people shows a mild positive correlation between the proportion of English and percentage of births to unmarried women in the United States with a correlation coefficient (R) of 0.343 and weighted average of 31.7%. Similarly, the statistical analysis conducted on geographies consisting of 269,712,118 people shows a substantial positive correlation between the proportion of Panamanians and percentage of births to unmarried women in the United States with a correlation coefficient (R) of 0.568 and weighted average of 34.2%, a difference of 7.7%.
Births to Unmarried Women Correlation Summary
| Measurement | English | Panamanian |
| Minimum | 4.5% | 4.5% |
| Maximum | 100.0% | 100.0% |
| Range | 95.5% | 95.5% |
| Mean | 38.5% | 55.4% |
| Median | 32.8% | 42.0% |
| Interquartile 25% (IQ1) | 25.5% | 33.4% |
| Interquartile 75% (IQ3) | 40.7% | 95.6% |
| Interquartile Range (IQR) | 15.2% | 62.2% |
| Standard Deviation (Sample) | 24.5% | 29.7% |
| Standard Deviation (Population) | 24.3% | 29.3% |
Similar Demographics by Births to Unmarried Women
Demographics Similar to English by Births to Unmarried Women
In terms of births to unmarried women, the demographic groups most similar to English are South American Indian (31.7%, a difference of 0.030%), South American (31.8%, a difference of 0.040%), Scottish (31.7%, a difference of 0.070%), Moroccan (31.8%, a difference of 0.15%), and Immigrants from Venezuela (31.7%, a difference of 0.17%).
| Demographics | Rating | Rank | Births to Unmarried Women |
| Finns | 50.5 /100 | #171 | Average 31.7% |
| Immigrants | Eritrea | 50.4 /100 | #172 | Average 31.7% |
| Immigrants | Yemen | 50.2 /100 | #173 | Average 31.7% |
| Venezuelans | 50.0 /100 | #174 | Average 31.7% |
| Immigrants | Venezuela | 49.2 /100 | #175 | Average 31.7% |
| Scottish | 48.1 /100 | #176 | Average 31.7% |
| South American Indians | 47.7 /100 | #177 | Average 31.7% |
| English | 47.4 /100 | #178 | Average 31.7% |
| South Americans | 46.9 /100 | #179 | Average 31.8% |
| Moroccans | 45.7 /100 | #180 | Average 31.8% |
| Immigrants | Peru | 45.1 /100 | #181 | Average 31.8% |
| Kenyans | 43.0 /100 | #182 | Average 31.9% |
| Canadians | 41.4 /100 | #183 | Average 31.9% |
| Immigrants | South America | 40.7 /100 | #184 | Average 32.0% |
| Germans | 39.5 /100 | #185 | Fair 32.0% |
Demographics Similar to Panamanians by Births to Unmarried Women
In terms of births to unmarried women, the demographic groups most similar to Panamanians are Immigrants from Panama (34.2%, a difference of 0.030%), Delaware (34.2%, a difference of 0.050%), Immigrants from Sierra Leone (34.2%, a difference of 0.11%), Ghanaian (34.3%, a difference of 0.13%), and Native Hawaiian (34.3%, a difference of 0.28%).
| Demographics | Rating | Rank | Births to Unmarried Women |
| Malaysians | 5.0 /100 | #221 | Tragic 33.9% |
| Immigrants | Uruguay | 4.8 /100 | #222 | Tragic 33.9% |
| Pennsylvania Germans | 4.3 /100 | #223 | Tragic 34.0% |
| Immigrants | Laos | 4.3 /100 | #224 | Tragic 34.0% |
| Spanish | 4.0 /100 | #225 | Tragic 34.1% |
| Delaware | 3.3 /100 | #226 | Tragic 34.2% |
| Immigrants | Panama | 3.3 /100 | #227 | Tragic 34.2% |
| Panamanians | 3.3 /100 | #228 | Tragic 34.2% |
| Immigrants | Sierra Leone | 3.1 /100 | #229 | Tragic 34.2% |
| Ghanaians | 3.1 /100 | #230 | Tragic 34.3% |
| Native Hawaiians | 2.9 /100 | #231 | Tragic 34.3% |
| French Canadians | 2.5 /100 | #232 | Tragic 34.4% |
| Bangladeshis | 2.5 /100 | #233 | Tragic 34.4% |
| Immigrants | Zaire | 2.3 /100 | #234 | Tragic 34.5% |
| Immigrants | Ghana | 2.2 /100 | #235 | Tragic 34.5% |