Romanian vs Immigrants from Russia Divorced or Separated
COMPARE
Romanian
Immigrants from Russia
Divorced or Separated
Divorced or Separated Comparison
Romanians
Immigrants from Russia
11.8%
DIVORCED OR SEPARATED
94.5/ 100
METRIC RATING
121st/ 347
METRIC RANK
11.3%
DIVORCED OR SEPARATED
99.9/ 100
METRIC RATING
60th/ 347
METRIC RANK
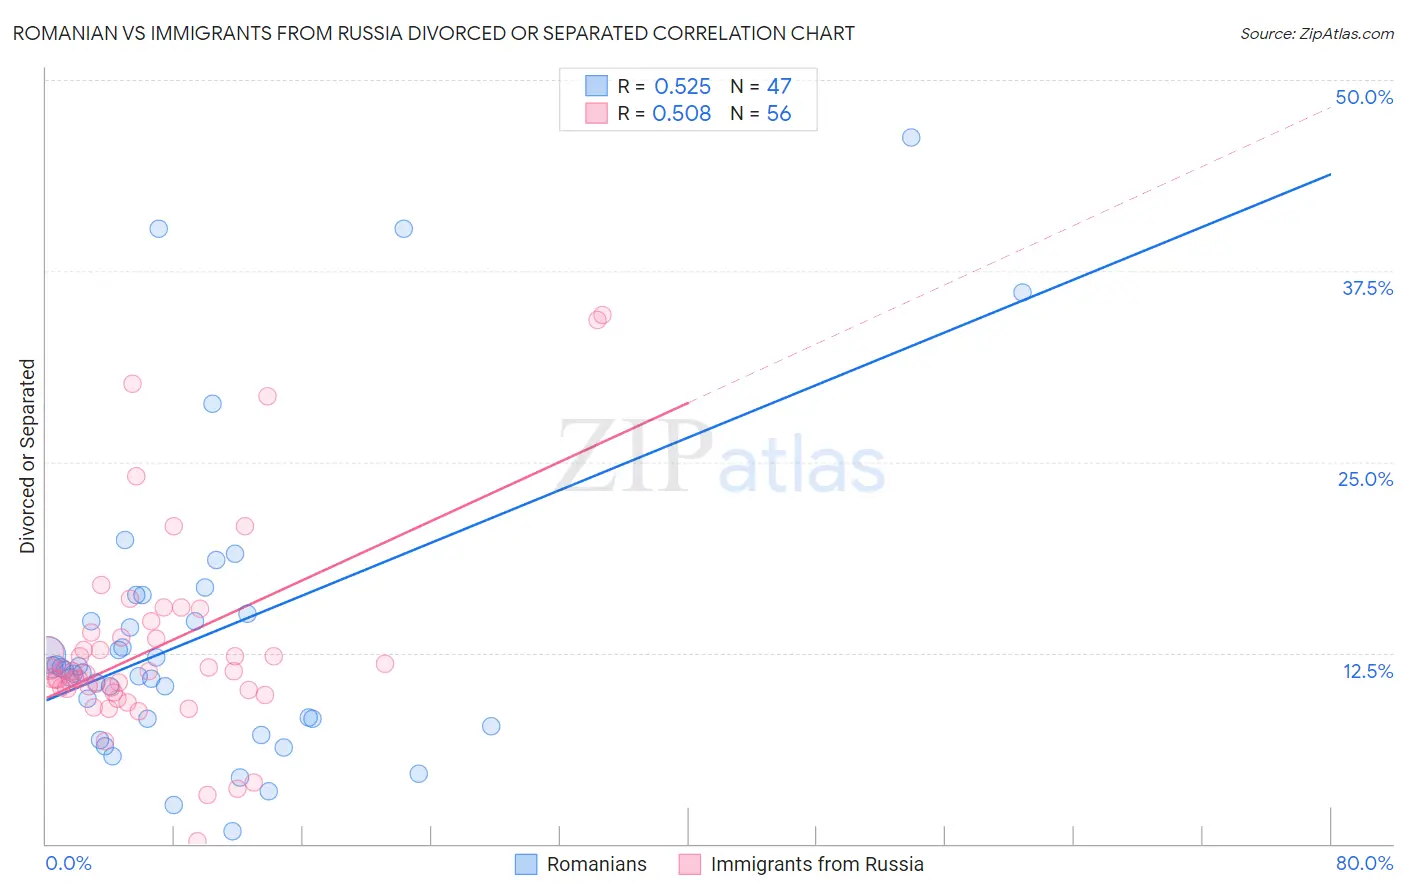
Romanian vs Immigrants from Russia Divorced or Separated Correlation Chart
The statistical analysis conducted on geographies consisting of 377,785,427 people shows a substantial positive correlation between the proportion of Romanians and percentage of population currently divorced or separated in the United States with a correlation coefficient (R) of 0.525 and weighted average of 11.8%. Similarly, the statistical analysis conducted on geographies consisting of 347,782,642 people shows a substantial positive correlation between the proportion of Immigrants from Russia and percentage of population currently divorced or separated in the United States with a correlation coefficient (R) of 0.508 and weighted average of 11.3%, a difference of 3.6%.
Divorced or Separated Correlation Summary
| Measurement | Romanian | Immigrants from Russia |
| Minimum | 0.80% | 0.20% |
| Maximum | 46.2% | 34.6% |
| Range | 45.4% | 34.4% |
| Mean | 13.6% | 12.9% |
| Median | 11.4% | 11.3% |
| Interquartile 25% (IQ1) | 8.2% | 10.1% |
| Interquartile 75% (IQ3) | 15.0% | 13.7% |
| Interquartile Range (IQR) | 6.8% | 3.5% |
| Standard Deviation (Sample) | 9.8% | 6.7% |
| Standard Deviation (Population) | 9.7% | 6.6% |
Similar Demographics by Divorced or Separated
Demographics Similar to Romanians by Divorced or Separated
In terms of divorced or separated, the demographic groups most similar to Romanians are Iraqi (11.8%, a difference of 0.010%), Syrian (11.7%, a difference of 0.10%), Menominee (11.8%, a difference of 0.12%), Immigrants (11.8%, a difference of 0.13%), and Ecuadorian (11.7%, a difference of 0.14%).
| Demographics | Rating | Rank | Divorced or Separated |
| Immigrants | Norway | 95.9 /100 | #114 | Exceptional 11.7% |
| Lithuanians | 95.7 /100 | #115 | Exceptional 11.7% |
| Immigrants | Iraq | 95.4 /100 | #116 | Exceptional 11.7% |
| Immigrants | Uganda | 95.3 /100 | #117 | Exceptional 11.7% |
| Ecuadorians | 95.3 /100 | #118 | Exceptional 11.7% |
| Syrians | 95.1 /100 | #119 | Exceptional 11.7% |
| Iraqis | 94.6 /100 | #120 | Exceptional 11.8% |
| Romanians | 94.5 /100 | #121 | Exceptional 11.8% |
| Menominee | 93.8 /100 | #122 | Exceptional 11.8% |
| Immigrants | Immigrants | 93.7 /100 | #123 | Exceptional 11.8% |
| Ugandans | 93.1 /100 | #124 | Exceptional 11.8% |
| Ukrainians | 92.3 /100 | #125 | Exceptional 11.8% |
| South American Indians | 92.1 /100 | #126 | Exceptional 11.8% |
| South Africans | 88.9 /100 | #127 | Excellent 11.8% |
| Immigrants | Ecuador | 88.9 /100 | #128 | Excellent 11.8% |
Demographics Similar to Immigrants from Russia by Divorced or Separated
In terms of divorced or separated, the demographic groups most similar to Immigrants from Russia are Korean (11.3%, a difference of 0.010%), Luxembourger (11.3%, a difference of 0.010%), Immigrants from Kuwait (11.3%, a difference of 0.020%), Israeli (11.3%, a difference of 0.16%), and Sri Lankan (11.3%, a difference of 0.26%).
| Demographics | Rating | Rank | Divorced or Separated |
| Immigrants | Lithuania | 99.9 /100 | #53 | Exceptional 11.3% |
| Eastern Europeans | 99.9 /100 | #54 | Exceptional 11.3% |
| Immigrants | Yemen | 99.9 /100 | #55 | Exceptional 11.3% |
| Immigrants | Philippines | 99.9 /100 | #56 | Exceptional 11.3% |
| Immigrants | Vietnam | 99.9 /100 | #57 | Exceptional 11.3% |
| Sri Lankans | 99.9 /100 | #58 | Exceptional 11.3% |
| Israelis | 99.9 /100 | #59 | Exceptional 11.3% |
| Immigrants | Russia | 99.9 /100 | #60 | Exceptional 11.3% |
| Koreans | 99.9 /100 | #61 | Exceptional 11.3% |
| Luxembourgers | 99.9 /100 | #62 | Exceptional 11.3% |
| Immigrants | Kuwait | 99.9 /100 | #63 | Exceptional 11.3% |
| Macedonians | 99.8 /100 | #64 | Exceptional 11.4% |
| Immigrants | South Eastern Asia | 99.8 /100 | #65 | Exceptional 11.4% |
| Inupiat | 99.8 /100 | #66 | Exceptional 11.4% |
| Immigrants | Syria | 99.7 /100 | #67 | Exceptional 11.4% |