Delaware vs Immigrants from Italy Divorced or Separated
COMPARE
Delaware
Immigrants from Italy
Divorced or Separated
Divorced or Separated Comparison
Delaware
Immigrants from Italy
12.7%
DIVORCED OR SEPARATED
0.1/ 100
METRIC RATING
283rd/ 347
METRIC RANK
11.5%
DIVORCED OR SEPARATED
99.5/ 100
METRIC RATING
77th/ 347
METRIC RANK
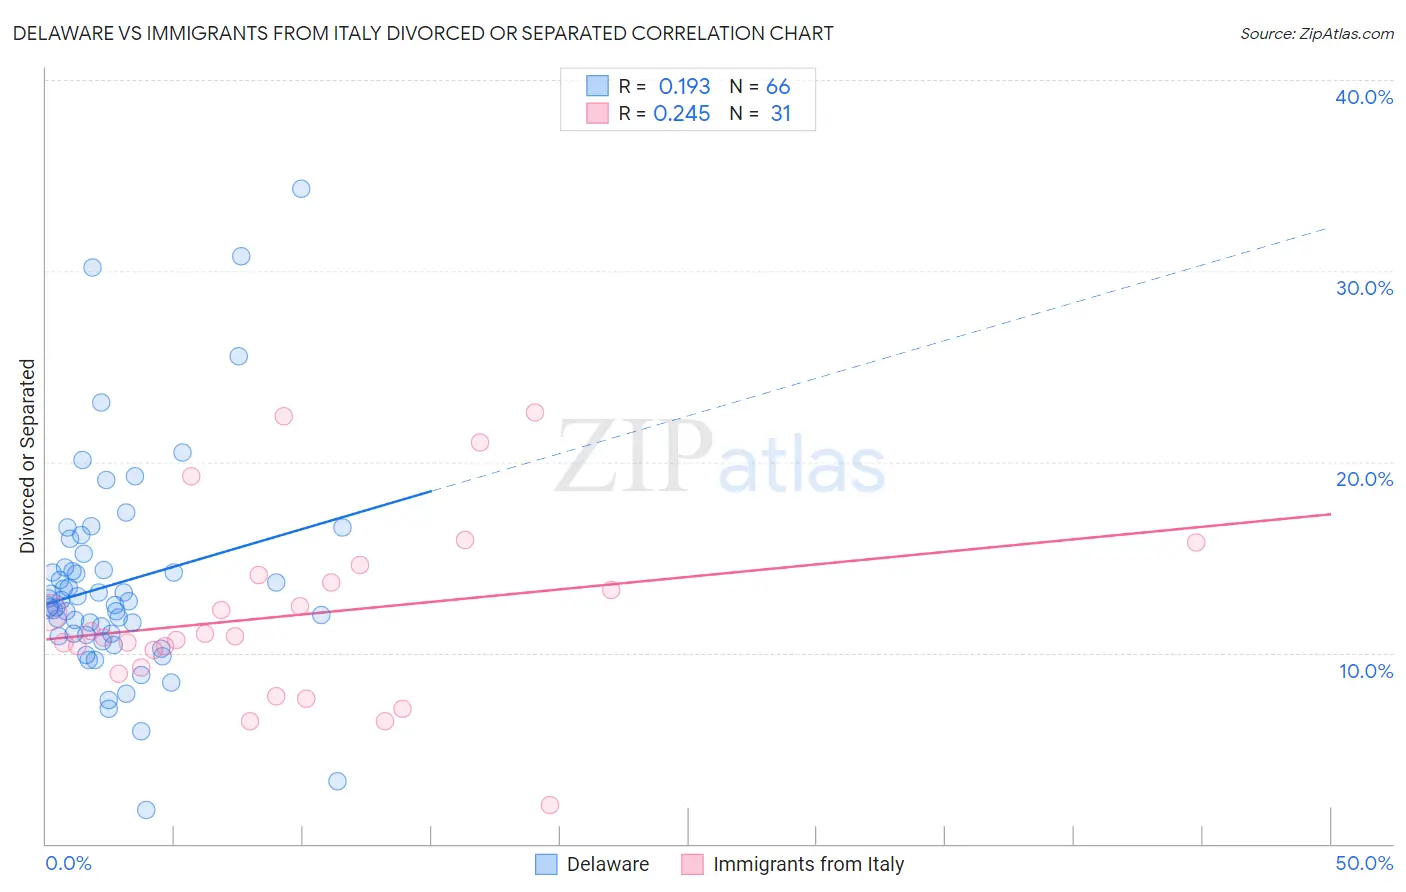
Delaware vs Immigrants from Italy Divorced or Separated Correlation Chart
The statistical analysis conducted on geographies consisting of 96,237,002 people shows a poor positive correlation between the proportion of Delaware and percentage of population currently divorced or separated in the United States with a correlation coefficient (R) of 0.193 and weighted average of 12.7%. Similarly, the statistical analysis conducted on geographies consisting of 324,175,792 people shows a weak positive correlation between the proportion of Immigrants from Italy and percentage of population currently divorced or separated in the United States with a correlation coefficient (R) of 0.245 and weighted average of 11.5%, a difference of 10.8%.
Divorced or Separated Correlation Summary
| Measurement | Delaware | Immigrants from Italy |
| Minimum | 1.8% | 2.0% |
| Maximum | 34.3% | 22.6% |
| Range | 32.5% | 20.6% |
| Mean | 13.6% | 12.0% |
| Median | 12.6% | 10.8% |
| Interquartile 25% (IQ1) | 10.9% | 9.2% |
| Interquartile 75% (IQ3) | 14.5% | 14.1% |
| Interquartile Range (IQR) | 3.5% | 4.9% |
| Standard Deviation (Sample) | 5.6% | 4.7% |
| Standard Deviation (Population) | 5.6% | 4.6% |
Similar Demographics by Divorced or Separated
Demographics Similar to Delaware by Divorced or Separated
In terms of divorced or separated, the demographic groups most similar to Delaware are Subsaharan African (12.7%, a difference of 0.010%), Nonimmigrants (12.8%, a difference of 0.090%), Pueblo (12.7%, a difference of 0.13%), French (12.8%, a difference of 0.13%), and Immigrants from Zaire (12.7%, a difference of 0.17%).
| Demographics | Rating | Rank | Divorced or Separated |
| Spaniards | 0.2 /100 | #276 | Tragic 12.7% |
| Dominicans | 0.2 /100 | #277 | Tragic 12.7% |
| Lumbee | 0.2 /100 | #278 | Tragic 12.7% |
| Immigrants | Dominican Republic | 0.2 /100 | #279 | Tragic 12.7% |
| Immigrants | Zaire | 0.2 /100 | #280 | Tragic 12.7% |
| Pueblo | 0.2 /100 | #281 | Tragic 12.7% |
| Sub-Saharan Africans | 0.1 /100 | #282 | Tragic 12.7% |
| Delaware | 0.1 /100 | #283 | Tragic 12.7% |
| Immigrants | Nonimmigrants | 0.1 /100 | #284 | Tragic 12.8% |
| French | 0.1 /100 | #285 | Tragic 12.8% |
| Spanish | 0.1 /100 | #286 | Tragic 12.8% |
| Hondurans | 0.1 /100 | #287 | Tragic 12.8% |
| French Canadians | 0.1 /100 | #288 | Tragic 12.8% |
| Iroquois | 0.0 /100 | #289 | Tragic 12.9% |
| Pima | 0.0 /100 | #290 | Tragic 12.9% |
Demographics Similar to Immigrants from Italy by Divorced or Separated
In terms of divorced or separated, the demographic groups most similar to Immigrants from Italy are Afghan (11.5%, a difference of 0.10%), Albanian (11.5%, a difference of 0.11%), Immigrants from Northern Africa (11.5%, a difference of 0.13%), Guyanese (11.5%, a difference of 0.14%), and Immigrants from Switzerland (11.5%, a difference of 0.16%).
| Demographics | Rating | Rank | Divorced or Separated |
| Immigrants | Eastern Europe | 99.7 /100 | #70 | Exceptional 11.5% |
| Paraguayans | 99.7 /100 | #71 | Exceptional 11.5% |
| Jordanians | 99.6 /100 | #72 | Exceptional 11.5% |
| Immigrants | North Macedonia | 99.6 /100 | #73 | Exceptional 11.5% |
| Taiwanese | 99.6 /100 | #74 | Exceptional 11.5% |
| Immigrants | Northern Africa | 99.6 /100 | #75 | Exceptional 11.5% |
| Albanians | 99.6 /100 | #76 | Exceptional 11.5% |
| Immigrants | Italy | 99.5 /100 | #77 | Exceptional 11.5% |
| Afghans | 99.4 /100 | #78 | Exceptional 11.5% |
| Guyanese | 99.4 /100 | #79 | Exceptional 11.5% |
| Immigrants | Switzerland | 99.4 /100 | #80 | Exceptional 11.5% |
| Russians | 99.4 /100 | #81 | Exceptional 11.5% |
| Immigrants | Romania | 99.3 /100 | #82 | Exceptional 11.5% |
| Immigrants | Bulgaria | 99.3 /100 | #83 | Exceptional 11.5% |
| Bulgarians | 99.3 /100 | #84 | Exceptional 11.5% |