French Canadian vs Brazilian Married-couple Households
COMPARE
French Canadian
Brazilian
Married-couple Households
Married-couple Households Comparison
French Canadians
Brazilians
47.5%
MARRIED-COUPLE HOUSEHOLDS
92.4/ 100
METRIC RATING
117th/ 347
METRIC RANK
46.2%
MARRIED-COUPLE HOUSEHOLDS
35.9/ 100
METRIC RATING
185th/ 347
METRIC RANK
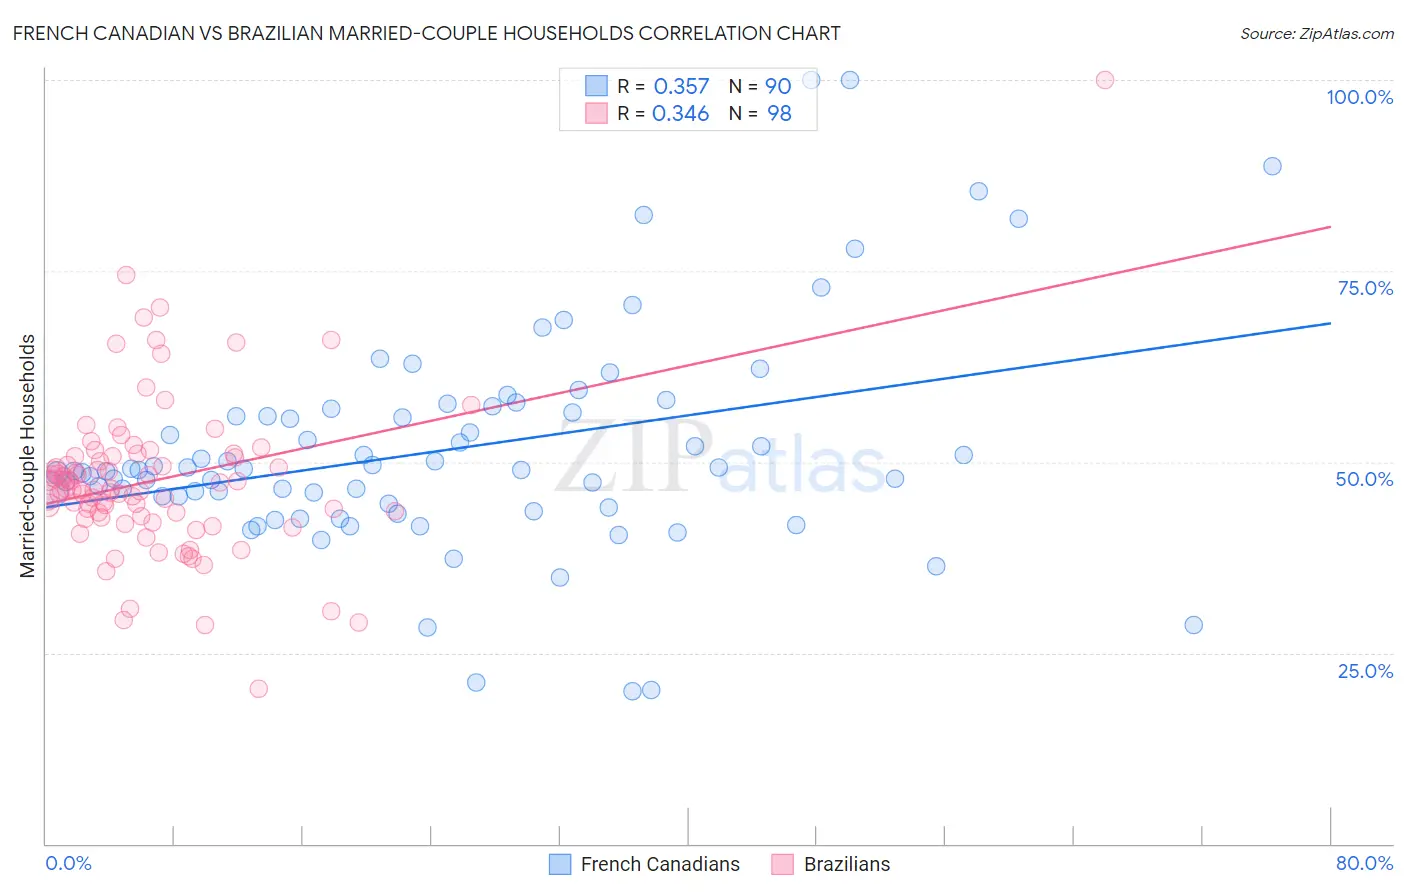
French Canadian vs Brazilian Married-couple Households Correlation Chart
The statistical analysis conducted on geographies consisting of 502,245,459 people shows a mild positive correlation between the proportion of French Canadians and percentage of married-couple family households in the United States with a correlation coefficient (R) of 0.357 and weighted average of 47.5%. Similarly, the statistical analysis conducted on geographies consisting of 323,707,241 people shows a mild positive correlation between the proportion of Brazilians and percentage of married-couple family households in the United States with a correlation coefficient (R) of 0.346 and weighted average of 46.2%, a difference of 2.9%.
Married-couple Households Correlation Summary
| Measurement | French Canadian | Brazilian |
| Minimum | 19.9% | 20.4% |
| Maximum | 100.0% | 100.0% |
| Range | 80.1% | 79.6% |
| Mean | 51.6% | 47.6% |
| Median | 48.9% | 46.4% |
| Interquartile 25% (IQ1) | 44.5% | 42.9% |
| Interquartile 75% (IQ3) | 56.5% | 50.7% |
| Interquartile Range (IQR) | 12.0% | 7.8% |
| Standard Deviation (Sample) | 14.4% | 10.4% |
| Standard Deviation (Population) | 14.4% | 10.4% |
Similar Demographics by Married-couple Households
Demographics Similar to French Canadians by Married-couple Households
In terms of married-couple households, the demographic groups most similar to French Canadians are Argentinean (47.5%, a difference of 0.010%), Immigrants from Germany (47.5%, a difference of 0.010%), Chilean (47.5%, a difference of 0.030%), Slovak (47.6%, a difference of 0.060%), and Immigrants from Europe (47.6%, a difference of 0.18%).
| Demographics | Rating | Rank | Married-couple Households |
| Macedonians | 93.9 /100 | #110 | Exceptional 47.6% |
| Syrians | 93.9 /100 | #111 | Exceptional 47.6% |
| Peruvians | 93.8 /100 | #112 | Exceptional 47.6% |
| Venezuelans | 93.8 /100 | #113 | Exceptional 47.6% |
| Immigrants | Europe | 93.7 /100 | #114 | Exceptional 47.6% |
| Slovaks | 92.9 /100 | #115 | Exceptional 47.6% |
| Argentineans | 92.5 /100 | #116 | Exceptional 47.5% |
| French Canadians | 92.4 /100 | #117 | Exceptional 47.5% |
| Immigrants | Germany | 92.4 /100 | #118 | Exceptional 47.5% |
| Chileans | 92.2 /100 | #119 | Exceptional 47.5% |
| Puget Sound Salish | 90.5 /100 | #120 | Exceptional 47.4% |
| Immigrants | Eastern Europe | 90.3 /100 | #121 | Exceptional 47.4% |
| Okinawans | 90.1 /100 | #122 | Exceptional 47.4% |
| Immigrants | Venezuela | 89.3 /100 | #123 | Excellent 47.4% |
| Zimbabweans | 89.2 /100 | #124 | Excellent 47.4% |
Demographics Similar to Brazilians by Married-couple Households
In terms of married-couple households, the demographic groups most similar to Brazilians are Immigrants from Switzerland (46.2%, a difference of 0.040%), Immigrants from Brazil (46.2%, a difference of 0.10%), Yugoslavian (46.2%, a difference of 0.12%), Albanian (46.1%, a difference of 0.20%), and Mongolian (46.3%, a difference of 0.24%).
| Demographics | Rating | Rank | Married-couple Households |
| Immigrants | Costa Rica | 43.4 /100 | #178 | Average 46.3% |
| Immigrants | Zimbabwe | 43.0 /100 | #179 | Average 46.3% |
| Mongolians | 42.0 /100 | #180 | Average 46.3% |
| Malaysians | 41.8 /100 | #181 | Average 46.3% |
| Yugoslavians | 38.9 /100 | #182 | Fair 46.2% |
| Immigrants | Brazil | 38.3 /100 | #183 | Fair 46.2% |
| Immigrants | Switzerland | 36.9 /100 | #184 | Fair 46.2% |
| Brazilians | 35.9 /100 | #185 | Fair 46.2% |
| Albanians | 31.1 /100 | #186 | Fair 46.1% |
| Fijians | 29.2 /100 | #187 | Fair 46.1% |
| South American Indians | 28.4 /100 | #188 | Fair 46.0% |
| Immigrants | Latvia | 26.9 /100 | #189 | Fair 46.0% |
| Immigrants | Kuwait | 25.6 /100 | #190 | Fair 46.0% |
| Choctaw | 24.9 /100 | #191 | Fair 46.0% |
| Immigrants | Northern Africa | 24.6 /100 | #192 | Fair 46.0% |