Filipino vs Cambodian Average Family Size
COMPARE
Filipino
Cambodian
Average Family Size
Average Family Size Comparison
Filipinos
Cambodians
3.20
AVERAGE FAMILY SIZE
13.6/ 100
METRIC RATING
207th/ 347
METRIC RANK
3.15
AVERAGE FAMILY SIZE
0.6/ 100
METRIC RATING
275th/ 347
METRIC RANK
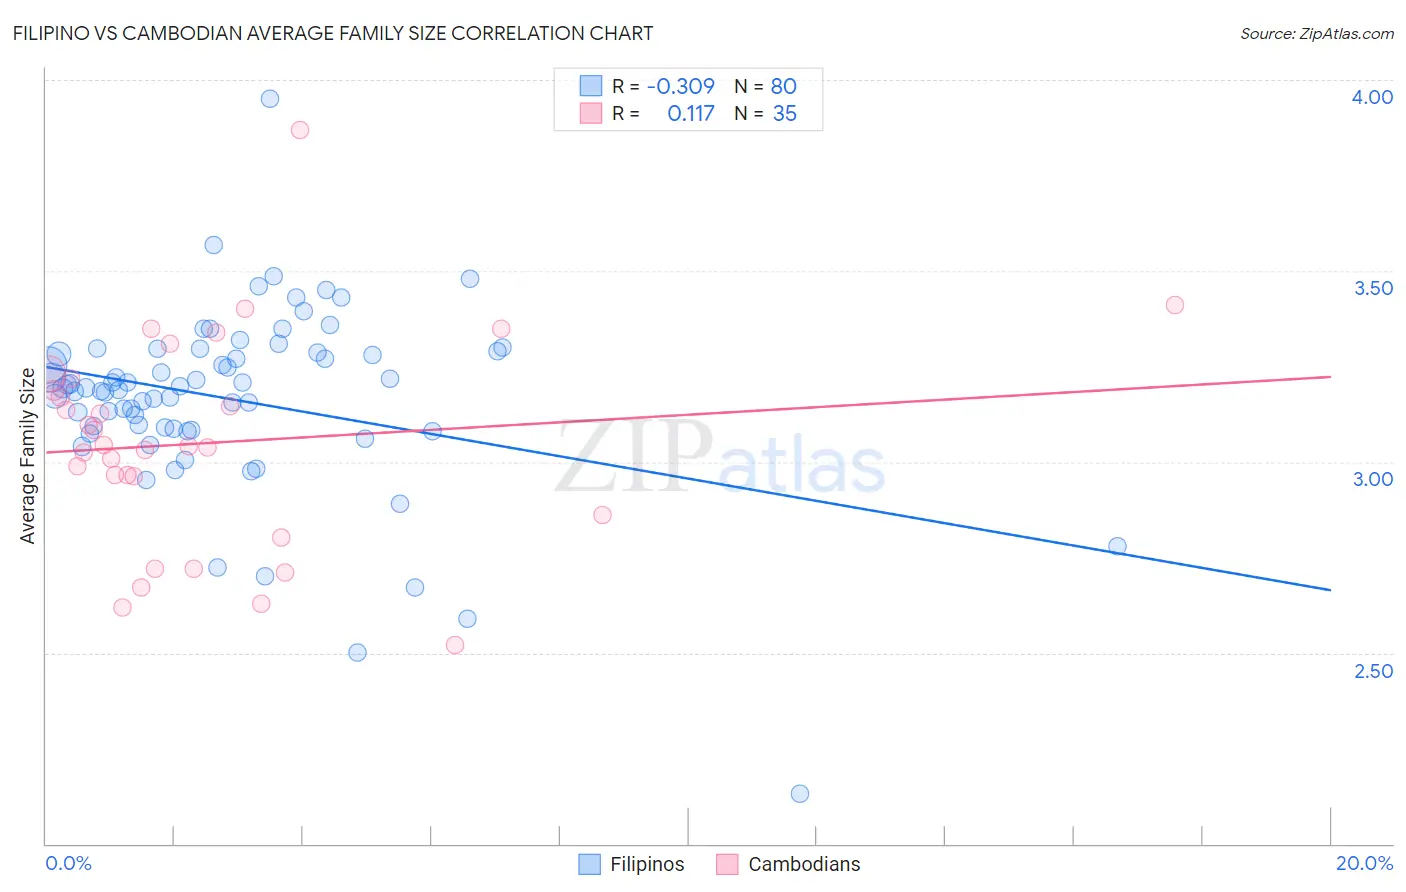
Filipino vs Cambodian Average Family Size Correlation Chart
The statistical analysis conducted on geographies consisting of 254,177,261 people shows a mild negative correlation between the proportion of Filipinos and average family size in the United States with a correlation coefficient (R) of -0.309 and weighted average of 3.20. Similarly, the statistical analysis conducted on geographies consisting of 102,468,433 people shows a poor positive correlation between the proportion of Cambodians and average family size in the United States with a correlation coefficient (R) of 0.117 and weighted average of 3.15, a difference of 1.5%.
Average Family Size Correlation Summary
| Measurement | Filipino | Cambodian |
| Minimum | 2.13 | 2.52 |
| Maximum | 3.95 | 3.87 |
| Range | 1.82 | 1.35 |
| Mean | 3.16 | 3.05 |
| Median | 3.19 | 3.04 |
| Interquartile 25% (IQ1) | 3.09 | 2.86 |
| Interquartile 75% (IQ3) | 3.29 | 3.22 |
| Interquartile Range (IQR) | 0.20 | 0.36 |
| Standard Deviation (Sample) | 0.24 | 0.28 |
| Standard Deviation (Population) | 0.24 | 0.27 |
Similar Demographics by Average Family Size
Demographics Similar to Filipinos by Average Family Size
In terms of average family size, the demographic groups most similar to Filipinos are Chippewa (3.20, a difference of 0.010%), Sudanese (3.20, a difference of 0.010%), Zimbabwean (3.20, a difference of 0.040%), Immigrants from Iran (3.20, a difference of 0.060%), and Creek (3.20, a difference of 0.060%).
| Demographics | Rating | Rank | Average Family Size |
| Immigrants | Kenya | 19.2 /100 | #200 | Poor 3.21 |
| Immigrants | Morocco | 18.5 /100 | #201 | Poor 3.21 |
| Immigrants | India | 18.5 /100 | #202 | Poor 3.21 |
| Immigrants | Nepal | 18.1 /100 | #203 | Poor 3.21 |
| Immigrants | Poland | 16.6 /100 | #204 | Poor 3.20 |
| Paraguayans | 16.3 /100 | #205 | Poor 3.20 |
| Immigrants | Cabo Verde | 16.0 /100 | #206 | Poor 3.20 |
| Filipinos | 13.6 /100 | #207 | Poor 3.20 |
| Chippewa | 13.3 /100 | #208 | Poor 3.20 |
| Sudanese | 13.3 /100 | #209 | Poor 3.20 |
| Zimbabweans | 12.6 /100 | #210 | Poor 3.20 |
| Immigrants | Iran | 12.1 /100 | #211 | Poor 3.20 |
| Creek | 12.1 /100 | #212 | Poor 3.20 |
| Mongolians | 11.5 /100 | #213 | Poor 3.20 |
| Somalis | 11.2 /100 | #214 | Poor 3.20 |
Demographics Similar to Cambodians by Average Family Size
In terms of average family size, the demographic groups most similar to Cambodians are Immigrants from Belgium (3.15, a difference of 0.0%), New Zealander (3.15, a difference of 0.010%), Immigrants from Lithuania (3.15, a difference of 0.020%), Immigrants from Germany (3.15, a difference of 0.040%), and Tlingit-Haida (3.16, a difference of 0.060%).
| Demographics | Rating | Rank | Average Family Size |
| Maltese | 0.8 /100 | #268 | Tragic 3.16 |
| Immigrants | Singapore | 0.7 /100 | #269 | Tragic 3.16 |
| Tlingit-Haida | 0.7 /100 | #270 | Tragic 3.16 |
| Immigrants | Germany | 0.7 /100 | #271 | Tragic 3.15 |
| Immigrants | Lithuania | 0.6 /100 | #272 | Tragic 3.15 |
| New Zealanders | 0.6 /100 | #273 | Tragic 3.15 |
| Immigrants | Belgium | 0.6 /100 | #274 | Tragic 3.15 |
| Cambodians | 0.6 /100 | #275 | Tragic 3.15 |
| Immigrants | Bosnia and Herzegovina | 0.5 /100 | #276 | Tragic 3.15 |
| Swiss | 0.5 /100 | #277 | Tragic 3.15 |
| Okinawans | 0.5 /100 | #278 | Tragic 3.15 |
| Immigrants | Europe | 0.5 /100 | #279 | Tragic 3.15 |
| Immigrants | England | 0.4 /100 | #280 | Tragic 3.15 |
| Immigrants | Denmark | 0.4 /100 | #281 | Tragic 3.15 |
| Yugoslavians | 0.4 /100 | #282 | Tragic 3.15 |