Filipino vs Yugoslavian Average Family Size
COMPARE
Filipino
Yugoslavian
Average Family Size
Average Family Size Comparison
Filipinos
Yugoslavians
3.20
AVERAGE FAMILY SIZE
13.6/ 100
METRIC RATING
207th/ 347
METRIC RANK
3.15
AVERAGE FAMILY SIZE
0.4/ 100
METRIC RATING
282nd/ 347
METRIC RANK
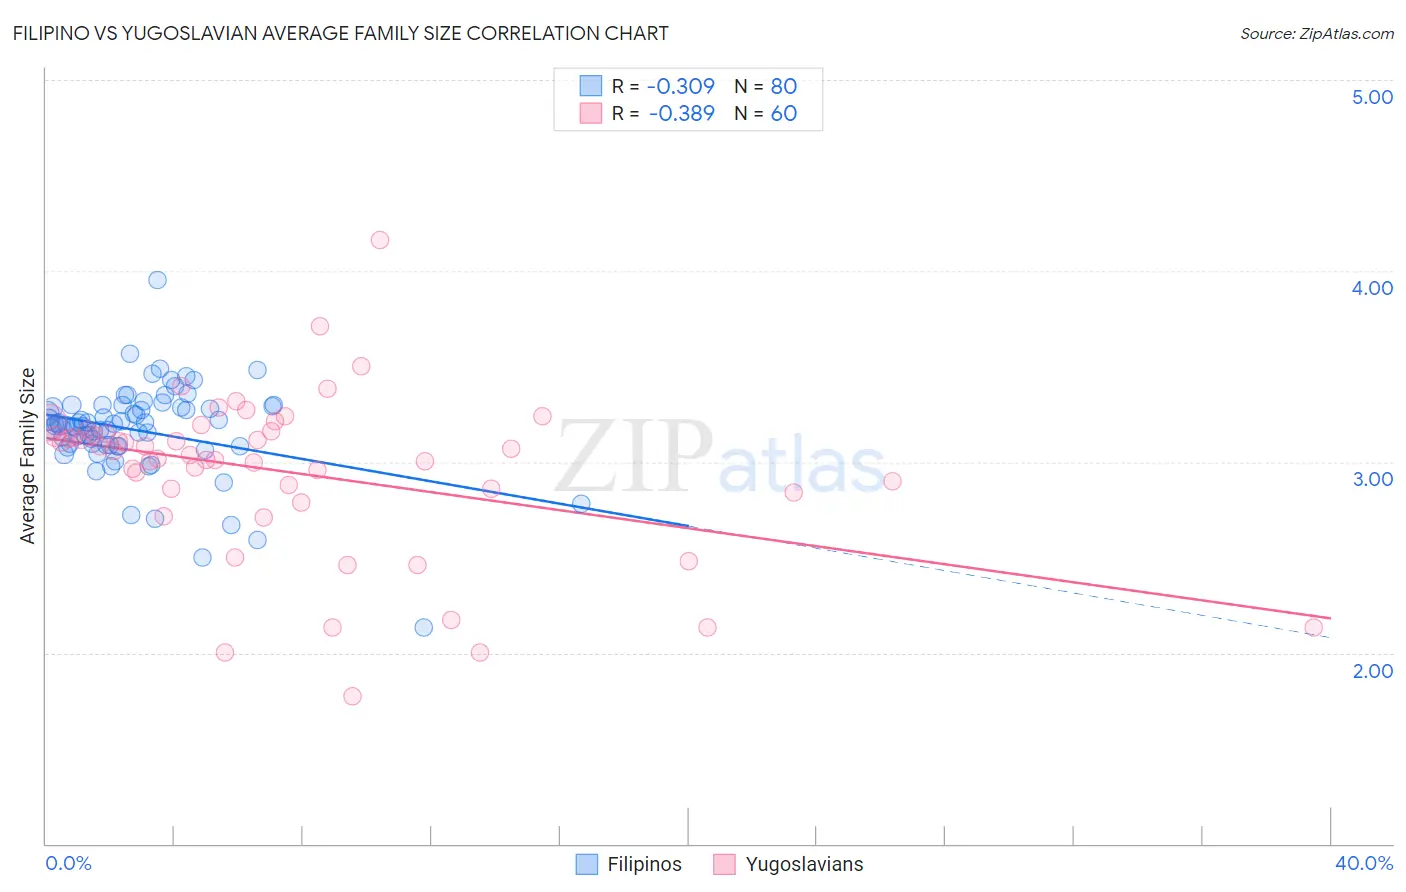
Filipino vs Yugoslavian Average Family Size Correlation Chart
The statistical analysis conducted on geographies consisting of 254,177,261 people shows a mild negative correlation between the proportion of Filipinos and average family size in the United States with a correlation coefficient (R) of -0.309 and weighted average of 3.20. Similarly, the statistical analysis conducted on geographies consisting of 285,640,029 people shows a mild negative correlation between the proportion of Yugoslavians and average family size in the United States with a correlation coefficient (R) of -0.389 and weighted average of 3.15, a difference of 1.7%.
Average Family Size Correlation Summary
| Measurement | Filipino | Yugoslavian |
| Minimum | 2.13 | 1.77 |
| Maximum | 3.95 | 4.16 |
| Range | 1.82 | 2.39 |
| Mean | 3.16 | 2.95 |
| Median | 3.19 | 3.05 |
| Interquartile 25% (IQ1) | 3.09 | 2.85 |
| Interquartile 75% (IQ3) | 3.29 | 3.15 |
| Interquartile Range (IQR) | 0.20 | 0.30 |
| Standard Deviation (Sample) | 0.24 | 0.43 |
| Standard Deviation (Population) | 0.24 | 0.43 |
Similar Demographics by Average Family Size
Demographics Similar to Filipinos by Average Family Size
In terms of average family size, the demographic groups most similar to Filipinos are Chippewa (3.20, a difference of 0.010%), Sudanese (3.20, a difference of 0.010%), Zimbabwean (3.20, a difference of 0.040%), Immigrants from Iran (3.20, a difference of 0.060%), and Creek (3.20, a difference of 0.060%).
| Demographics | Rating | Rank | Average Family Size |
| Immigrants | Kenya | 19.2 /100 | #200 | Poor 3.21 |
| Immigrants | Morocco | 18.5 /100 | #201 | Poor 3.21 |
| Immigrants | India | 18.5 /100 | #202 | Poor 3.21 |
| Immigrants | Nepal | 18.1 /100 | #203 | Poor 3.21 |
| Immigrants | Poland | 16.6 /100 | #204 | Poor 3.20 |
| Paraguayans | 16.3 /100 | #205 | Poor 3.20 |
| Immigrants | Cabo Verde | 16.0 /100 | #206 | Poor 3.20 |
| Filipinos | 13.6 /100 | #207 | Poor 3.20 |
| Chippewa | 13.3 /100 | #208 | Poor 3.20 |
| Sudanese | 13.3 /100 | #209 | Poor 3.20 |
| Zimbabweans | 12.6 /100 | #210 | Poor 3.20 |
| Immigrants | Iran | 12.1 /100 | #211 | Poor 3.20 |
| Creek | 12.1 /100 | #212 | Poor 3.20 |
| Mongolians | 11.5 /100 | #213 | Poor 3.20 |
| Somalis | 11.2 /100 | #214 | Poor 3.20 |
Demographics Similar to Yugoslavians by Average Family Size
In terms of average family size, the demographic groups most similar to Yugoslavians are Immigrants from Denmark (3.15, a difference of 0.010%), German Russian (3.15, a difference of 0.010%), Immigrants from France (3.15, a difference of 0.030%), Immigrants from England (3.15, a difference of 0.040%), and Immigrants from Europe (3.15, a difference of 0.070%).
| Demographics | Rating | Rank | Average Family Size |
| Cambodians | 0.6 /100 | #275 | Tragic 3.15 |
| Immigrants | Bosnia and Herzegovina | 0.5 /100 | #276 | Tragic 3.15 |
| Swiss | 0.5 /100 | #277 | Tragic 3.15 |
| Okinawans | 0.5 /100 | #278 | Tragic 3.15 |
| Immigrants | Europe | 0.5 /100 | #279 | Tragic 3.15 |
| Immigrants | England | 0.4 /100 | #280 | Tragic 3.15 |
| Immigrants | Denmark | 0.4 /100 | #281 | Tragic 3.15 |
| Yugoslavians | 0.4 /100 | #282 | Tragic 3.15 |
| German Russians | 0.4 /100 | #283 | Tragic 3.15 |
| Immigrants | France | 0.4 /100 | #284 | Tragic 3.15 |
| Whites/Caucasians | 0.3 /100 | #285 | Tragic 3.14 |
| Immigrants | Netherlands | 0.3 /100 | #286 | Tragic 3.14 |
| Greeks | 0.3 /100 | #287 | Tragic 3.14 |
| Immigrants | Czechoslovakia | 0.3 /100 | #288 | Tragic 3.14 |
| Immigrants | Norway | 0.3 /100 | #289 | Tragic 3.14 |