Greek vs Cambodian Average Family Size
COMPARE
Greek
Cambodian
Average Family Size
Average Family Size Comparison
Greeks
Cambodians
3.14
AVERAGE FAMILY SIZE
0.3/ 100
METRIC RATING
287th/ 347
METRIC RANK
3.15
AVERAGE FAMILY SIZE
0.6/ 100
METRIC RATING
275th/ 347
METRIC RANK
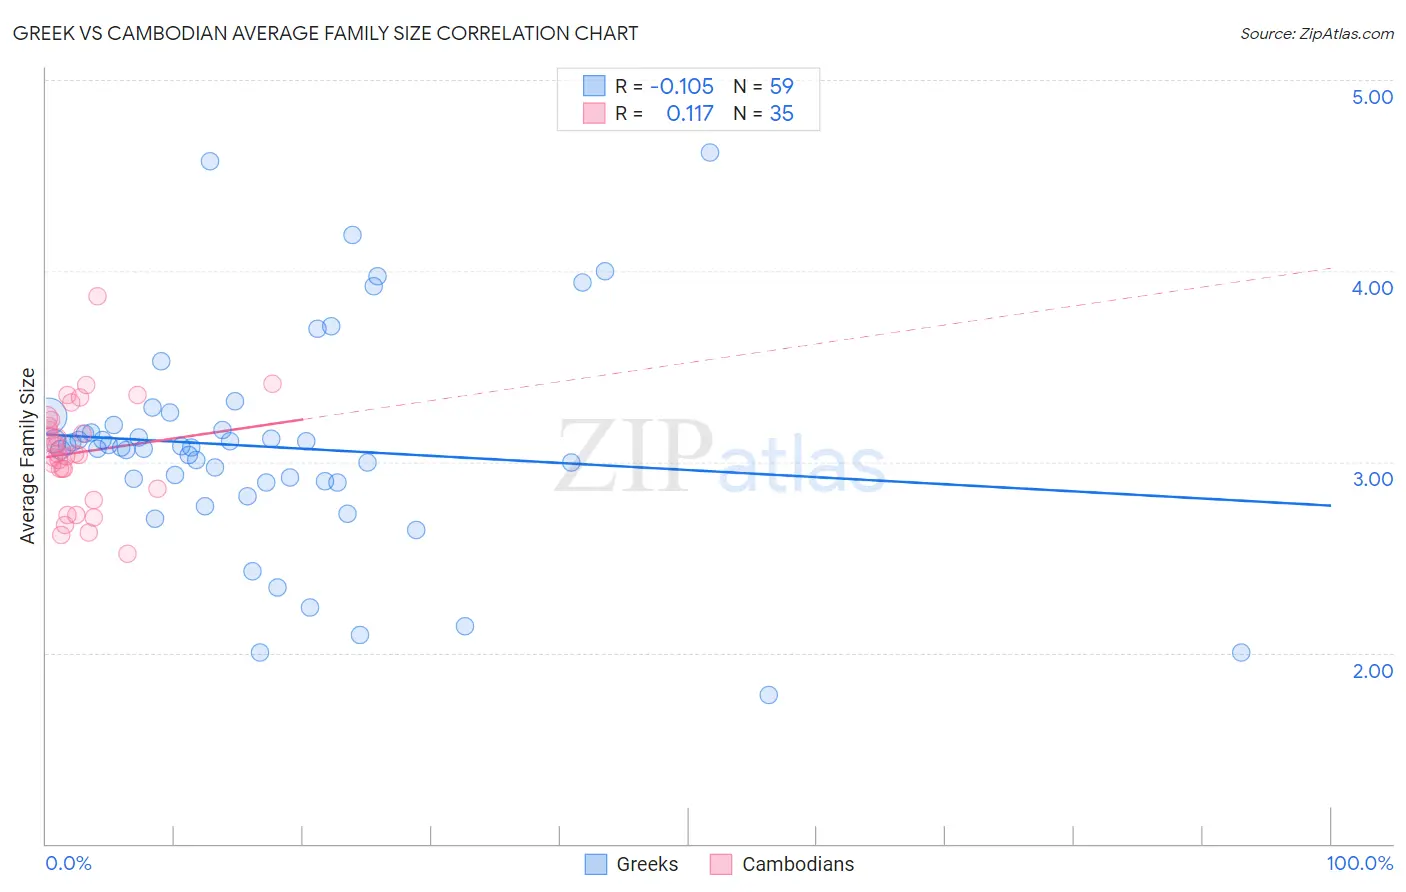
Greek vs Cambodian Average Family Size Correlation Chart
The statistical analysis conducted on geographies consisting of 482,359,857 people shows a poor negative correlation between the proportion of Greeks and average family size in the United States with a correlation coefficient (R) of -0.105 and weighted average of 3.14. Similarly, the statistical analysis conducted on geographies consisting of 102,468,433 people shows a poor positive correlation between the proportion of Cambodians and average family size in the United States with a correlation coefficient (R) of 0.117 and weighted average of 3.15, a difference of 0.35%.
Average Family Size Correlation Summary
| Measurement | Greek | Cambodian |
| Minimum | 1.78 | 2.52 |
| Maximum | 4.62 | 3.87 |
| Range | 2.84 | 1.35 |
| Mean | 3.08 | 3.05 |
| Median | 3.08 | 3.04 |
| Interquartile 25% (IQ1) | 2.89 | 2.86 |
| Interquartile 75% (IQ3) | 3.19 | 3.22 |
| Interquartile Range (IQR) | 0.30 | 0.36 |
| Standard Deviation (Sample) | 0.56 | 0.28 |
| Standard Deviation (Population) | 0.56 | 0.27 |
Demographics Similar to Greeks and Cambodians by Average Family Size
In terms of average family size, the demographic groups most similar to Greeks are Immigrants from Czechoslovakia (3.14, a difference of 0.0%), Immigrants from Norway (3.14, a difference of 0.0%), Immigrants from Netherlands (3.14, a difference of 0.010%), Cypriot (3.14, a difference of 0.030%), and White/Caucasian (3.14, a difference of 0.060%). Similarly, the demographic groups most similar to Cambodians are Immigrants from Belgium (3.15, a difference of 0.0%), New Zealander (3.15, a difference of 0.010%), Immigrants from Lithuania (3.15, a difference of 0.020%), Immigrants from Germany (3.15, a difference of 0.040%), and Immigrants from Bosnia and Herzegovina (3.15, a difference of 0.080%).
| Demographics | Rating | Rank | Average Family Size |
| Immigrants | Germany | 0.7 /100 | #271 | Tragic 3.15 |
| Immigrants | Lithuania | 0.6 /100 | #272 | Tragic 3.15 |
| New Zealanders | 0.6 /100 | #273 | Tragic 3.15 |
| Immigrants | Belgium | 0.6 /100 | #274 | Tragic 3.15 |
| Cambodians | 0.6 /100 | #275 | Tragic 3.15 |
| Immigrants | Bosnia and Herzegovina | 0.5 /100 | #276 | Tragic 3.15 |
| Swiss | 0.5 /100 | #277 | Tragic 3.15 |
| Okinawans | 0.5 /100 | #278 | Tragic 3.15 |
| Immigrants | Europe | 0.5 /100 | #279 | Tragic 3.15 |
| Immigrants | England | 0.4 /100 | #280 | Tragic 3.15 |
| Immigrants | Denmark | 0.4 /100 | #281 | Tragic 3.15 |
| Yugoslavians | 0.4 /100 | #282 | Tragic 3.15 |
| German Russians | 0.4 /100 | #283 | Tragic 3.15 |
| Immigrants | France | 0.4 /100 | #284 | Tragic 3.15 |
| Whites/Caucasians | 0.3 /100 | #285 | Tragic 3.14 |
| Immigrants | Netherlands | 0.3 /100 | #286 | Tragic 3.14 |
| Greeks | 0.3 /100 | #287 | Tragic 3.14 |
| Immigrants | Czechoslovakia | 0.3 /100 | #288 | Tragic 3.14 |
| Immigrants | Norway | 0.3 /100 | #289 | Tragic 3.14 |
| Cypriots | 0.3 /100 | #290 | Tragic 3.14 |
| Alsatians | 0.2 /100 | #291 | Tragic 3.14 |