Pima vs Cambodian Average Family Size
COMPARE
Pima
Cambodian
Average Family Size
Average Family Size Comparison
Pima
Cambodians
3.75
AVERAGE FAMILY SIZE
100/ 100
METRIC RATING
4th/ 347
METRIC RANK
3.15
AVERAGE FAMILY SIZE
0.6/ 100
METRIC RATING
275th/ 347
METRIC RANK
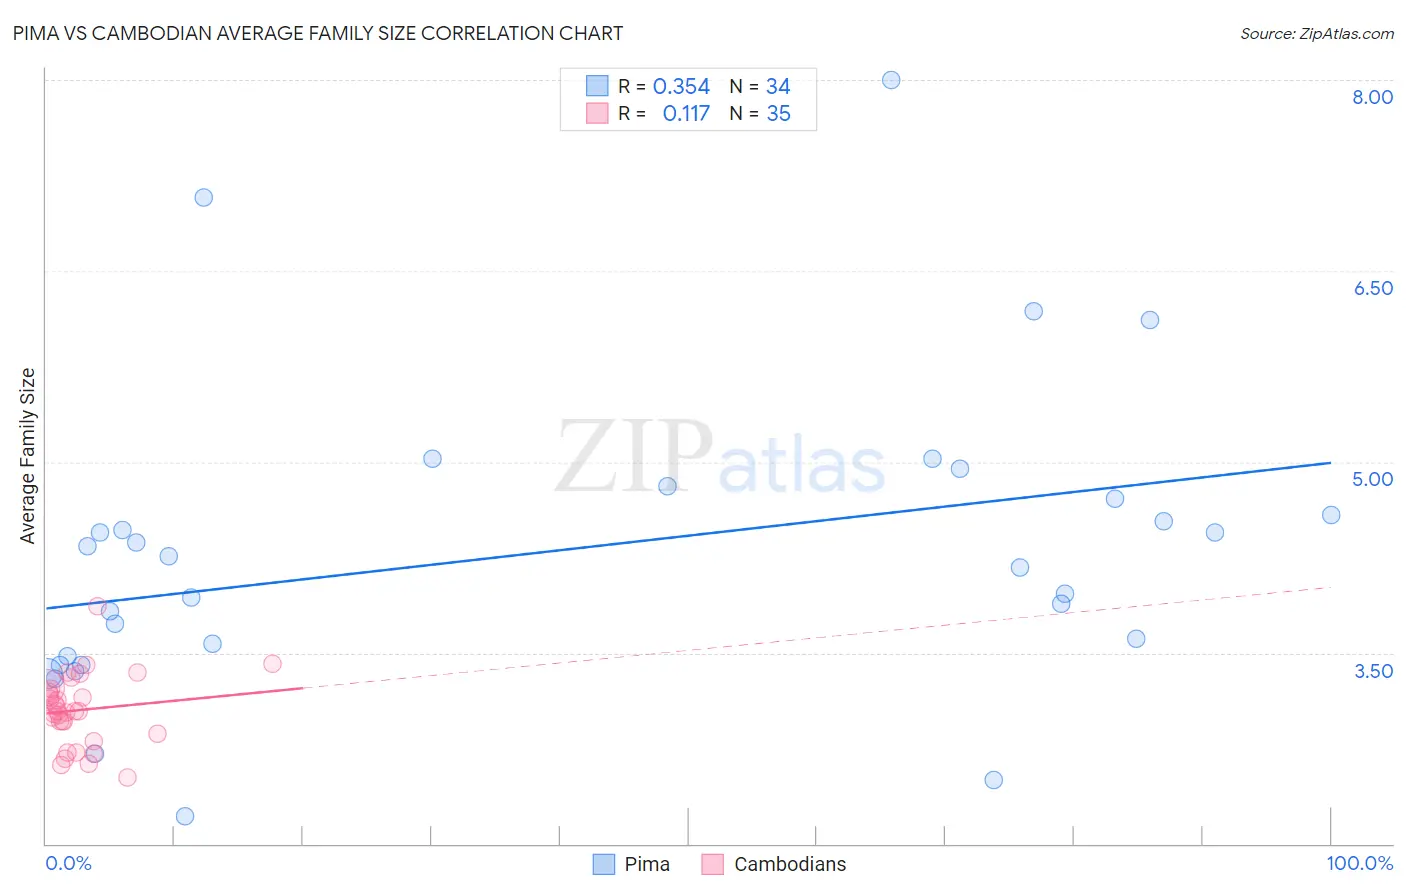
Pima vs Cambodian Average Family Size Correlation Chart
The statistical analysis conducted on geographies consisting of 61,539,566 people shows a mild positive correlation between the proportion of Pima and average family size in the United States with a correlation coefficient (R) of 0.354 and weighted average of 3.75. Similarly, the statistical analysis conducted on geographies consisting of 102,468,433 people shows a poor positive correlation between the proportion of Cambodians and average family size in the United States with a correlation coefficient (R) of 0.117 and weighted average of 3.15, a difference of 18.8%.
Average Family Size Correlation Summary
| Measurement | Pima | Cambodian |
| Minimum | 2.22 | 2.52 |
| Maximum | 8.00 | 3.87 |
| Range | 5.78 | 1.35 |
| Mean | 4.29 | 3.05 |
| Median | 4.21 | 3.04 |
| Interquartile 25% (IQ1) | 3.48 | 2.86 |
| Interquartile 75% (IQ3) | 4.71 | 3.22 |
| Interquartile Range (IQR) | 1.23 | 0.36 |
| Standard Deviation (Sample) | 1.20 | 0.28 |
| Standard Deviation (Population) | 1.18 | 0.27 |
Similar Demographics by Average Family Size
Demographics Similar to Pima by Average Family Size
In terms of average family size, the demographic groups most similar to Pima are Pueblo (3.79, a difference of 1.3%), Crow (3.82, a difference of 2.1%), Navajo (3.65, a difference of 2.8%), Arapaho (3.64, a difference of 3.1%), and Inupiat (3.63, a difference of 3.3%).
| Demographics | Rating | Rank | Average Family Size |
| Yup'ik | 100 /100 | #1 | Exceptional 4.00 |
| Crow | 100 /100 | #2 | Exceptional 3.82 |
| Pueblo | 100 /100 | #3 | Exceptional 3.79 |
| Pima | 100 /100 | #4 | Exceptional 3.75 |
| Navajo | 100.0 /100 | #5 | Exceptional 3.65 |
| Arapaho | 100.0 /100 | #6 | Exceptional 3.64 |
| Inupiat | 100.0 /100 | #7 | Exceptional 3.63 |
| Immigrants | Yemen | 100.0 /100 | #8 | Exceptional 3.60 |
| Hopi | 100.0 /100 | #9 | Exceptional 3.60 |
| Spanish American Indians | 100.0 /100 | #10 | Exceptional 3.58 |
| Tohono O'odham | 100.0 /100 | #11 | Exceptional 3.53 |
| Immigrants | Mexico | 100.0 /100 | #12 | Exceptional 3.52 |
| Sioux | 100.0 /100 | #13 | Exceptional 3.52 |
| Immigrants | Central America | 100.0 /100 | #14 | Exceptional 3.49 |
| Tongans | 100.0 /100 | #15 | Exceptional 3.49 |
Demographics Similar to Cambodians by Average Family Size
In terms of average family size, the demographic groups most similar to Cambodians are Immigrants from Belgium (3.15, a difference of 0.0%), New Zealander (3.15, a difference of 0.010%), Immigrants from Lithuania (3.15, a difference of 0.020%), Immigrants from Germany (3.15, a difference of 0.040%), and Tlingit-Haida (3.16, a difference of 0.060%).
| Demographics | Rating | Rank | Average Family Size |
| Maltese | 0.8 /100 | #268 | Tragic 3.16 |
| Immigrants | Singapore | 0.7 /100 | #269 | Tragic 3.16 |
| Tlingit-Haida | 0.7 /100 | #270 | Tragic 3.16 |
| Immigrants | Germany | 0.7 /100 | #271 | Tragic 3.15 |
| Immigrants | Lithuania | 0.6 /100 | #272 | Tragic 3.15 |
| New Zealanders | 0.6 /100 | #273 | Tragic 3.15 |
| Immigrants | Belgium | 0.6 /100 | #274 | Tragic 3.15 |
| Cambodians | 0.6 /100 | #275 | Tragic 3.15 |
| Immigrants | Bosnia and Herzegovina | 0.5 /100 | #276 | Tragic 3.15 |
| Swiss | 0.5 /100 | #277 | Tragic 3.15 |
| Okinawans | 0.5 /100 | #278 | Tragic 3.15 |
| Immigrants | Europe | 0.5 /100 | #279 | Tragic 3.15 |
| Immigrants | England | 0.4 /100 | #280 | Tragic 3.15 |
| Immigrants | Denmark | 0.4 /100 | #281 | Tragic 3.15 |
| Yugoslavians | 0.4 /100 | #282 | Tragic 3.15 |