Filipino vs Cambodian Unemployment Among Seniors over 75 years
COMPARE
Filipino
Cambodian
Unemployment Among Seniors over 75 years
Unemployment Among Seniors over 75 years Comparison
Filipinos
Cambodians
7.9%
UNEMPLOYMENT AMONG SENIORS OVER 75 YEARS
99.9/ 100
METRIC RATING
55th/ 347
METRIC RANK
7.6%
UNEMPLOYMENT AMONG SENIORS OVER 75 YEARS
100.0/ 100
METRIC RATING
33rd/ 347
METRIC RANK
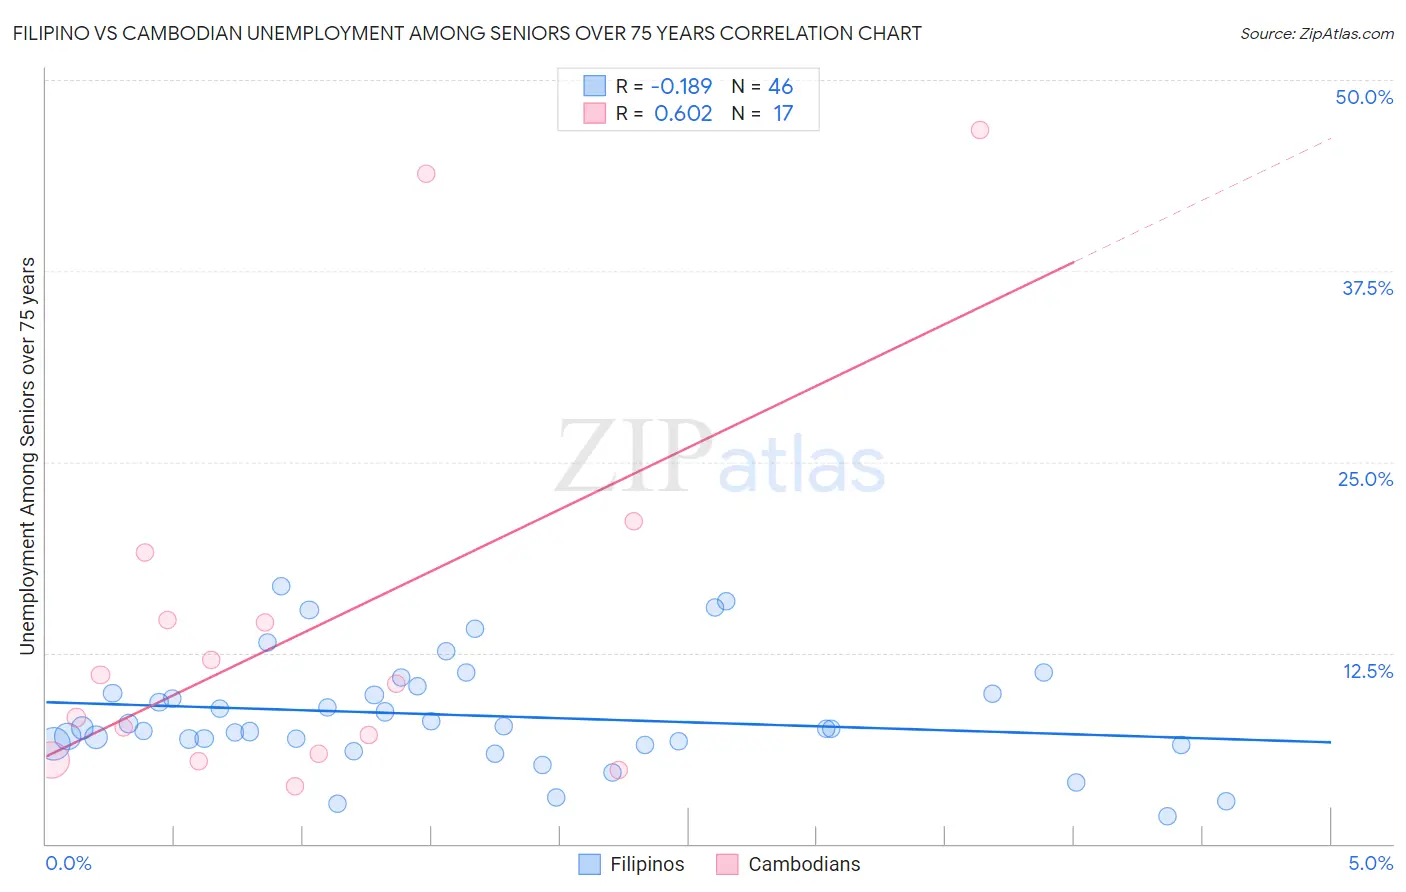
Filipino vs Cambodian Unemployment Among Seniors over 75 years Correlation Chart
The statistical analysis conducted on geographies consisting of 152,741,914 people shows a poor negative correlation between the proportion of Filipinos and unemployment rate among seniors over the age of 75 in the United States with a correlation coefficient (R) of -0.189 and weighted average of 7.9%. Similarly, the statistical analysis conducted on geographies consisting of 78,067,296 people shows a significant positive correlation between the proportion of Cambodians and unemployment rate among seniors over the age of 75 in the United States with a correlation coefficient (R) of 0.602 and weighted average of 7.6%, a difference of 3.0%.
Unemployment Among Seniors over 75 years Correlation Summary
| Measurement | Filipino | Cambodian |
| Minimum | 1.8% | 3.8% |
| Maximum | 16.9% | 46.7% |
| Range | 15.1% | 42.9% |
| Mean | 8.4% | 14.2% |
| Median | 7.5% | 10.5% |
| Interquartile 25% (IQ1) | 6.5% | 5.7% |
| Interquartile 75% (IQ3) | 9.9% | 16.8% |
| Interquartile Range (IQR) | 3.3% | 11.1% |
| Standard Deviation (Sample) | 3.5% | 12.7% |
| Standard Deviation (Population) | 3.5% | 12.3% |
Similar Demographics by Unemployment Among Seniors over 75 years
Demographics Similar to Filipinos by Unemployment Among Seniors over 75 years
In terms of unemployment among seniors over 75 years, the demographic groups most similar to Filipinos are Immigrants from Eastern Asia (7.9%, a difference of 0.010%), Ottawa (7.9%, a difference of 0.18%), Iranian (7.9%, a difference of 0.23%), Immigrants from Malaysia (7.9%, a difference of 0.32%), and Immigrants from Egypt (7.9%, a difference of 0.36%).
| Demographics | Rating | Rank | Unemployment Among Seniors over 75 years |
| Immigrants | Chile | 100.0 /100 | #48 | Exceptional 7.8% |
| Potawatomi | 100.0 /100 | #49 | Exceptional 7.8% |
| Immigrants | Latvia | 100.0 /100 | #50 | Exceptional 7.8% |
| Moroccans | 100.0 /100 | #51 | Exceptional 7.8% |
| Bahamians | 100.0 /100 | #52 | Exceptional 7.8% |
| Immigrants | Egypt | 100.0 /100 | #53 | Exceptional 7.9% |
| Immigrants | Malaysia | 99.9 /100 | #54 | Exceptional 7.9% |
| Filipinos | 99.9 /100 | #55 | Exceptional 7.9% |
| Immigrants | Eastern Asia | 99.9 /100 | #56 | Exceptional 7.9% |
| Ottawa | 99.9 /100 | #57 | Exceptional 7.9% |
| Iranians | 99.9 /100 | #58 | Exceptional 7.9% |
| Indonesians | 99.9 /100 | #59 | Exceptional 7.9% |
| Immigrants | Morocco | 99.9 /100 | #60 | Exceptional 7.9% |
| Uruguayans | 99.9 /100 | #61 | Exceptional 7.9% |
| Immigrants | Albania | 99.9 /100 | #62 | Exceptional 7.9% |
Demographics Similar to Cambodians by Unemployment Among Seniors over 75 years
In terms of unemployment among seniors over 75 years, the demographic groups most similar to Cambodians are Immigrants from Hong Kong (7.6%, a difference of 0.010%), Immigrants from Eritrea (7.7%, a difference of 0.24%), Immigrants from Norway (7.7%, a difference of 0.45%), Guyanese (7.6%, a difference of 0.51%), and Luxembourger (7.7%, a difference of 0.55%).
| Demographics | Rating | Rank | Unemployment Among Seniors over 75 years |
| South Africans | 100.0 /100 | #26 | Exceptional 7.5% |
| Immigrants | Barbados | 100.0 /100 | #27 | Exceptional 7.6% |
| Immigrants | Israel | 100.0 /100 | #28 | Exceptional 7.6% |
| Immigrants | Iran | 100.0 /100 | #29 | Exceptional 7.6% |
| Immigrants | Sweden | 100.0 /100 | #30 | Exceptional 7.6% |
| Guyanese | 100.0 /100 | #31 | Exceptional 7.6% |
| Immigrants | Hong Kong | 100.0 /100 | #32 | Exceptional 7.6% |
| Cambodians | 100.0 /100 | #33 | Exceptional 7.6% |
| Immigrants | Eritrea | 100.0 /100 | #34 | Exceptional 7.7% |
| Immigrants | Norway | 100.0 /100 | #35 | Exceptional 7.7% |
| Luxembourgers | 100.0 /100 | #36 | Exceptional 7.7% |
| Immigrants | Hungary | 100.0 /100 | #37 | Exceptional 7.7% |
| Kiowa | 100.0 /100 | #38 | Exceptional 7.7% |
| Ugandans | 100.0 /100 | #39 | Exceptional 7.7% |
| Colville | 100.0 /100 | #40 | Exceptional 7.7% |