Fijian vs Subsaharan African Divorced or Separated
COMPARE
Fijian
Subsaharan African
Divorced or Separated
Divorced or Separated Comparison
Fijians
Sub-Saharan Africans
12.6%
DIVORCED OR SEPARATED
0.4/ 100
METRIC RATING
268th/ 347
METRIC RANK
12.7%
DIVORCED OR SEPARATED
0.1/ 100
METRIC RATING
282nd/ 347
METRIC RANK
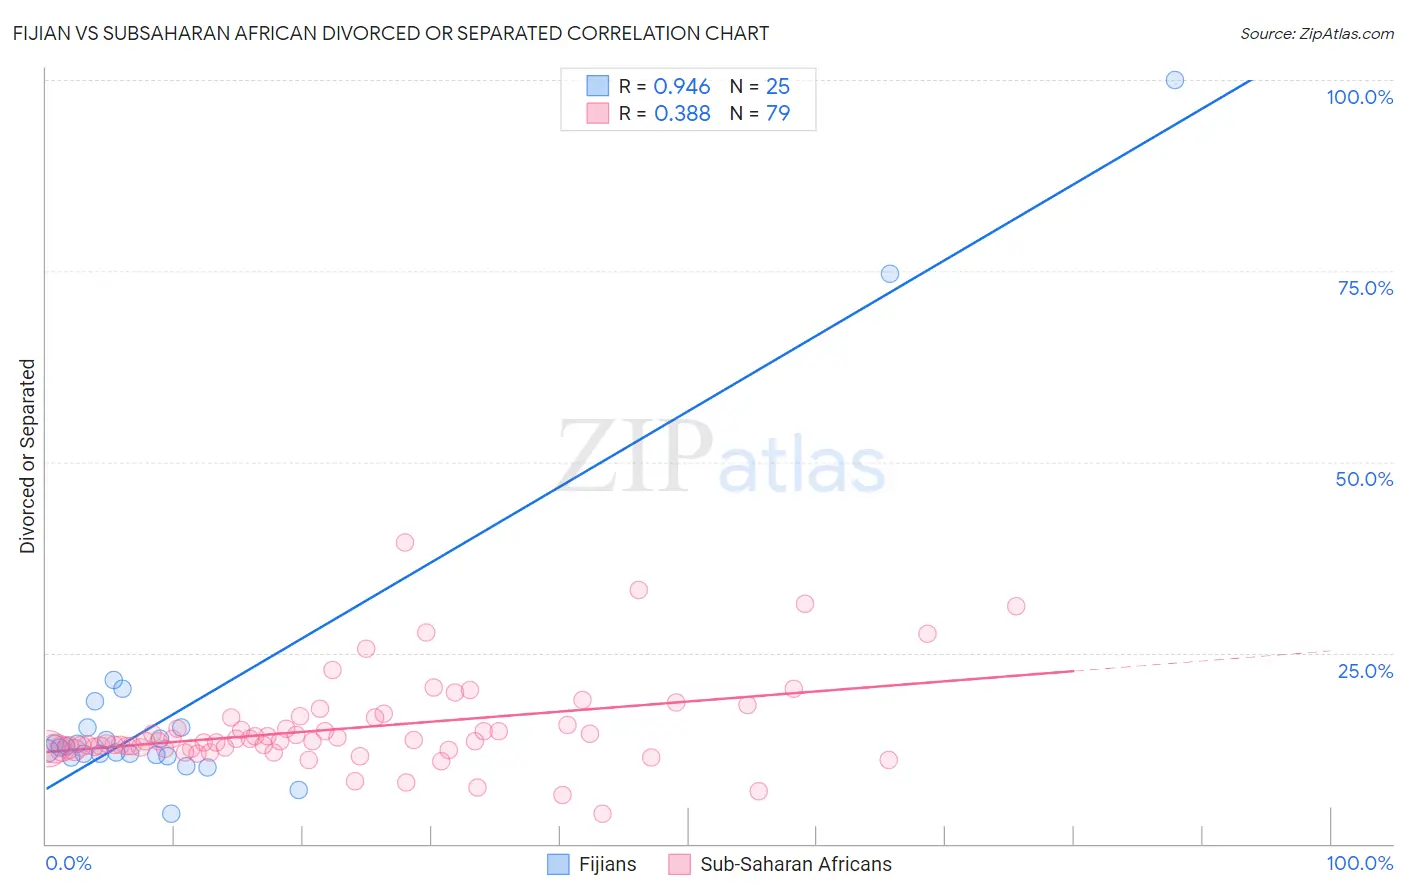
Fijian vs Subsaharan African Divorced or Separated Correlation Chart
The statistical analysis conducted on geographies consisting of 55,948,408 people shows a near-perfect positive correlation between the proportion of Fijians and percentage of population currently divorced or separated in the United States with a correlation coefficient (R) of 0.946 and weighted average of 12.6%. Similarly, the statistical analysis conducted on geographies consisting of 507,827,607 people shows a mild positive correlation between the proportion of Sub-Saharan Africans and percentage of population currently divorced or separated in the United States with a correlation coefficient (R) of 0.388 and weighted average of 12.7%, a difference of 0.90%.
Divorced or Separated Correlation Summary
| Measurement | Fijian | Subsaharan African |
| Minimum | 4.0% | 3.9% |
| Maximum | 100.0% | 39.4% |
| Range | 96.0% | 35.5% |
| Mean | 18.8% | 15.1% |
| Median | 12.6% | 13.4% |
| Interquartile 25% (IQ1) | 11.6% | 12.5% |
| Interquartile 75% (IQ3) | 15.3% | 16.5% |
| Interquartile Range (IQR) | 3.7% | 4.0% |
| Standard Deviation (Sample) | 21.3% | 6.0% |
| Standard Deviation (Population) | 20.8% | 5.9% |
Demographics Similar to Fijians and Sub-Saharan Africans by Divorced or Separated
In terms of divorced or separated, the demographic groups most similar to Fijians are Scottish (12.6%, a difference of 0.010%), Immigrants from Liberia (12.6%, a difference of 0.010%), White/Caucasian (12.6%, a difference of 0.060%), Immigrants from Senegal (12.6%, a difference of 0.070%), and Ute (12.6%, a difference of 0.13%). Similarly, the demographic groups most similar to Sub-Saharan Africans are Delaware (12.7%, a difference of 0.010%), Nonimmigrants (12.8%, a difference of 0.10%), Pueblo (12.7%, a difference of 0.12%), French (12.8%, a difference of 0.14%), and Immigrants from Zaire (12.7%, a difference of 0.16%).
| Demographics | Rating | Rank | Divorced or Separated |
| Immigrants | Senegal | 0.5 /100 | #265 | Tragic 12.6% |
| Whites/Caucasians | 0.5 /100 | #266 | Tragic 12.6% |
| Scottish | 0.4 /100 | #267 | Tragic 12.6% |
| Fijians | 0.4 /100 | #268 | Tragic 12.6% |
| Immigrants | Liberia | 0.4 /100 | #269 | Tragic 12.6% |
| Ute | 0.4 /100 | #270 | Tragic 12.6% |
| Panamanians | 0.3 /100 | #271 | Tragic 12.7% |
| Immigrants | Middle Africa | 0.3 /100 | #272 | Tragic 12.7% |
| Immigrants | Micronesia | 0.3 /100 | #273 | Tragic 12.7% |
| Bermudans | 0.3 /100 | #274 | Tragic 12.7% |
| Central American Indians | 0.3 /100 | #275 | Tragic 12.7% |
| Spaniards | 0.2 /100 | #276 | Tragic 12.7% |
| Dominicans | 0.2 /100 | #277 | Tragic 12.7% |
| Lumbee | 0.2 /100 | #278 | Tragic 12.7% |
| Immigrants | Dominican Republic | 0.2 /100 | #279 | Tragic 12.7% |
| Immigrants | Zaire | 0.2 /100 | #280 | Tragic 12.7% |
| Pueblo | 0.2 /100 | #281 | Tragic 12.7% |
| Sub-Saharan Africans | 0.1 /100 | #282 | Tragic 12.7% |
| Delaware | 0.1 /100 | #283 | Tragic 12.7% |
| Immigrants | Nonimmigrants | 0.1 /100 | #284 | Tragic 12.8% |
| French | 0.1 /100 | #285 | Tragic 12.8% |