Delaware vs Subsaharan African Divorced or Separated
COMPARE
Delaware
Subsaharan African
Divorced or Separated
Divorced or Separated Comparison
Delaware
Sub-Saharan Africans
12.7%
DIVORCED OR SEPARATED
0.1/ 100
METRIC RATING
283rd/ 347
METRIC RANK
12.7%
DIVORCED OR SEPARATED
0.1/ 100
METRIC RATING
282nd/ 347
METRIC RANK
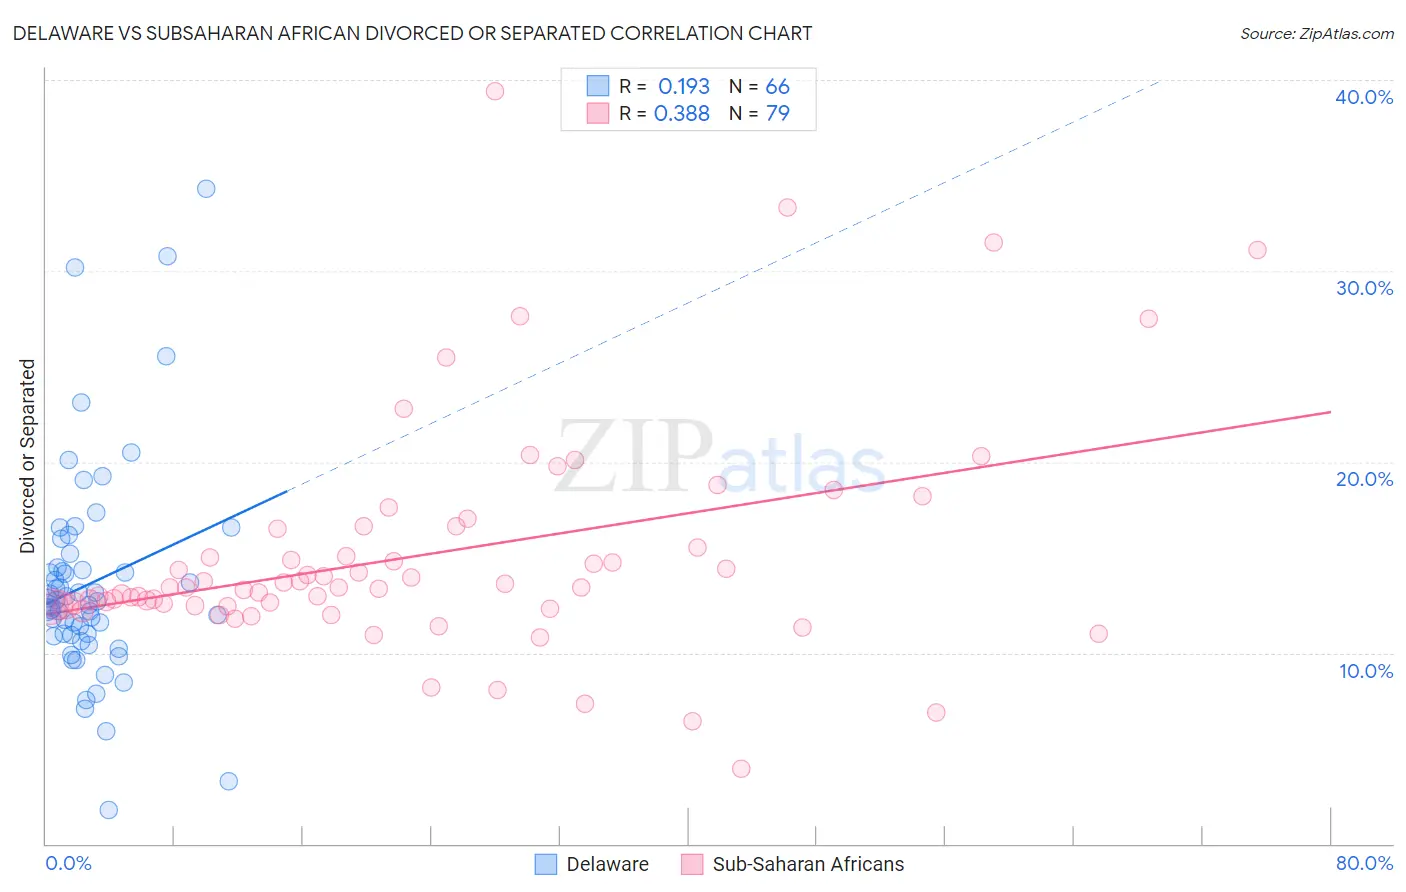
Delaware vs Subsaharan African Divorced or Separated Correlation Chart
The statistical analysis conducted on geographies consisting of 96,237,002 people shows a poor positive correlation between the proportion of Delaware and percentage of population currently divorced or separated in the United States with a correlation coefficient (R) of 0.193 and weighted average of 12.7%. Similarly, the statistical analysis conducted on geographies consisting of 507,827,607 people shows a mild positive correlation between the proportion of Sub-Saharan Africans and percentage of population currently divorced or separated in the United States with a correlation coefficient (R) of 0.388 and weighted average of 12.7%, a difference of 0.010%.
Divorced or Separated Correlation Summary
| Measurement | Delaware | Subsaharan African |
| Minimum | 1.8% | 3.9% |
| Maximum | 34.3% | 39.4% |
| Range | 32.5% | 35.5% |
| Mean | 13.6% | 15.1% |
| Median | 12.6% | 13.4% |
| Interquartile 25% (IQ1) | 10.9% | 12.5% |
| Interquartile 75% (IQ3) | 14.5% | 16.5% |
| Interquartile Range (IQR) | 3.5% | 4.0% |
| Standard Deviation (Sample) | 5.6% | 6.0% |
| Standard Deviation (Population) | 5.6% | 5.9% |
Demographics Similar to Delaware and Sub-Saharan Africans by Divorced or Separated
In terms of divorced or separated, the demographic groups most similar to Delaware are Nonimmigrants (12.8%, a difference of 0.090%), Pueblo (12.7%, a difference of 0.13%), French (12.8%, a difference of 0.13%), Immigrants from Zaire (12.7%, a difference of 0.17%), and Immigrants from Dominican Republic (12.7%, a difference of 0.23%). Similarly, the demographic groups most similar to Sub-Saharan Africans are Nonimmigrants (12.8%, a difference of 0.10%), Pueblo (12.7%, a difference of 0.12%), French (12.8%, a difference of 0.14%), Immigrants from Zaire (12.7%, a difference of 0.16%), and Lumbee (12.7%, a difference of 0.23%).
| Demographics | Rating | Rank | Divorced or Separated |
| Immigrants | Middle Africa | 0.3 /100 | #272 | Tragic 12.7% |
| Immigrants | Micronesia | 0.3 /100 | #273 | Tragic 12.7% |
| Bermudans | 0.3 /100 | #274 | Tragic 12.7% |
| Central American Indians | 0.3 /100 | #275 | Tragic 12.7% |
| Spaniards | 0.2 /100 | #276 | Tragic 12.7% |
| Dominicans | 0.2 /100 | #277 | Tragic 12.7% |
| Lumbee | 0.2 /100 | #278 | Tragic 12.7% |
| Immigrants | Dominican Republic | 0.2 /100 | #279 | Tragic 12.7% |
| Immigrants | Zaire | 0.2 /100 | #280 | Tragic 12.7% |
| Pueblo | 0.2 /100 | #281 | Tragic 12.7% |
| Sub-Saharan Africans | 0.1 /100 | #282 | Tragic 12.7% |
| Delaware | 0.1 /100 | #283 | Tragic 12.7% |
| Immigrants | Nonimmigrants | 0.1 /100 | #284 | Tragic 12.8% |
| French | 0.1 /100 | #285 | Tragic 12.8% |
| Spanish | 0.1 /100 | #286 | Tragic 12.8% |
| Hondurans | 0.1 /100 | #287 | Tragic 12.8% |
| French Canadians | 0.1 /100 | #288 | Tragic 12.8% |
| Iroquois | 0.0 /100 | #289 | Tragic 12.9% |
| Pima | 0.0 /100 | #290 | Tragic 12.9% |
| Immigrants | Honduras | 0.0 /100 | #291 | Tragic 12.9% |
| Scotch-Irish | 0.0 /100 | #292 | Tragic 12.9% |