Slovene vs Subsaharan African Divorced or Separated
COMPARE
Slovene
Subsaharan African
Divorced or Separated
Divorced or Separated Comparison
Slovenes
Sub-Saharan Africans
12.3%
DIVORCED OR SEPARATED
13.2/ 100
METRIC RATING
218th/ 347
METRIC RANK
12.7%
DIVORCED OR SEPARATED
0.1/ 100
METRIC RATING
282nd/ 347
METRIC RANK
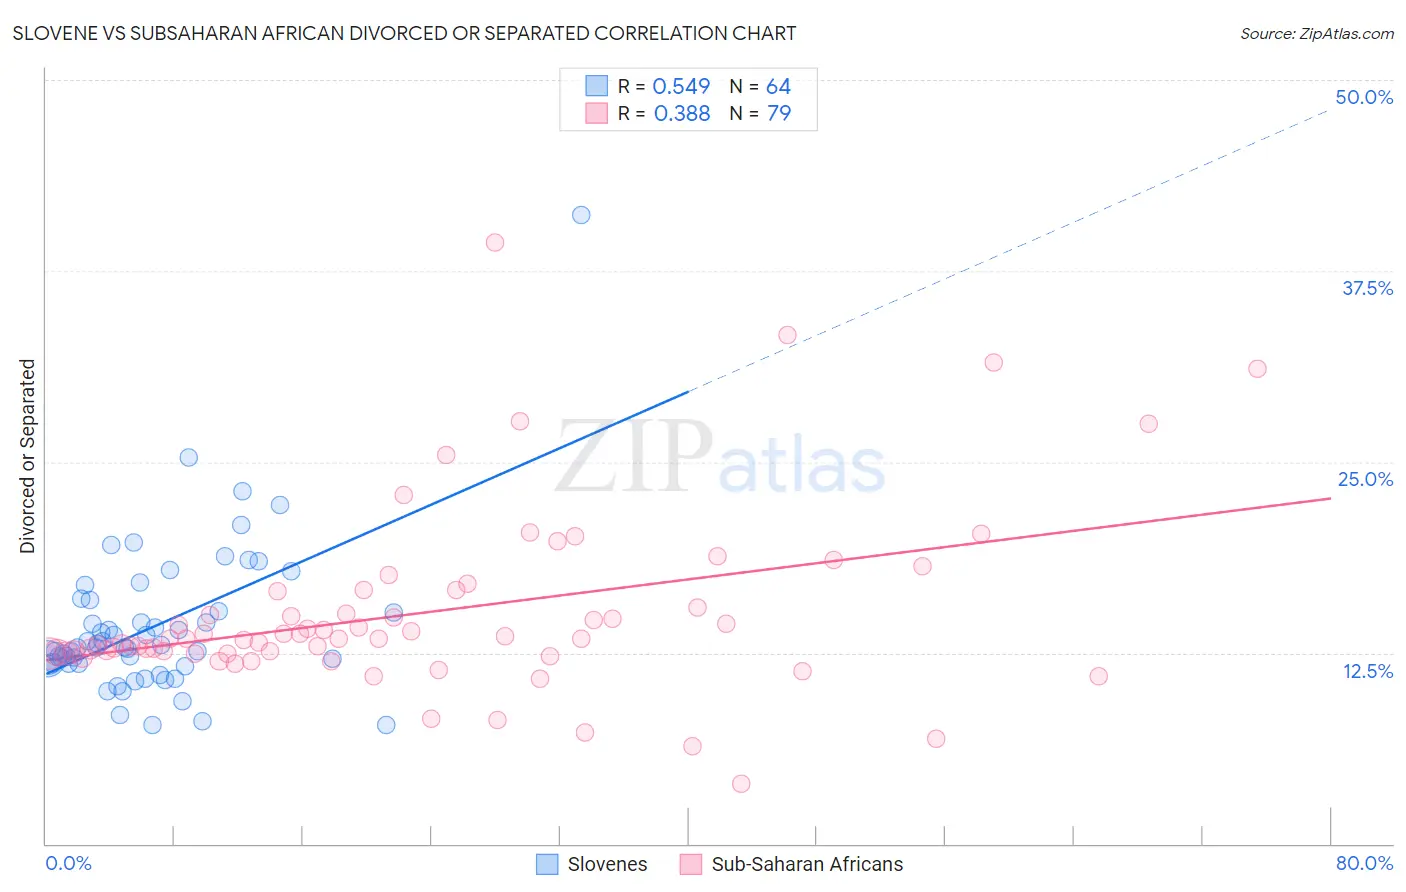
Slovene vs Subsaharan African Divorced or Separated Correlation Chart
The statistical analysis conducted on geographies consisting of 261,286,451 people shows a substantial positive correlation between the proportion of Slovenes and percentage of population currently divorced or separated in the United States with a correlation coefficient (R) of 0.549 and weighted average of 12.3%. Similarly, the statistical analysis conducted on geographies consisting of 507,827,607 people shows a mild positive correlation between the proportion of Sub-Saharan Africans and percentage of population currently divorced or separated in the United States with a correlation coefficient (R) of 0.388 and weighted average of 12.7%, a difference of 4.0%.
Divorced or Separated Correlation Summary
| Measurement | Slovene | Subsaharan African |
| Minimum | 7.7% | 3.9% |
| Maximum | 41.2% | 39.4% |
| Range | 33.5% | 35.5% |
| Mean | 14.2% | 15.1% |
| Median | 12.9% | 13.4% |
| Interquartile 25% (IQ1) | 11.8% | 12.5% |
| Interquartile 75% (IQ3) | 15.6% | 16.5% |
| Interquartile Range (IQR) | 3.8% | 4.0% |
| Standard Deviation (Sample) | 5.0% | 6.0% |
| Standard Deviation (Population) | 5.0% | 5.9% |
Similar Demographics by Divorced or Separated
Demographics Similar to Slovenes by Divorced or Separated
In terms of divorced or separated, the demographic groups most similar to Slovenes are Northern European (12.2%, a difference of 0.11%), Czechoslovakian (12.3%, a difference of 0.11%), British (12.3%, a difference of 0.12%), Immigrants from South America (12.2%, a difference of 0.15%), and Guamanian/Chamorro (12.3%, a difference of 0.15%).
| Demographics | Rating | Rank | Divorced or Separated |
| Trinidadians and Tobagonians | 16.6 /100 | #211 | Poor 12.2% |
| Immigrants | Kenya | 16.5 /100 | #212 | Poor 12.2% |
| Immigrants | Eastern Africa | 16.2 /100 | #213 | Poor 12.2% |
| Immigrants | Argentina | 15.5 /100 | #214 | Poor 12.2% |
| Europeans | 15.4 /100 | #215 | Poor 12.2% |
| Immigrants | South America | 15.4 /100 | #216 | Poor 12.2% |
| Northern Europeans | 14.7 /100 | #217 | Poor 12.2% |
| Slovenes | 13.2 /100 | #218 | Poor 12.3% |
| Czechoslovakians | 11.7 /100 | #219 | Poor 12.3% |
| British | 11.6 /100 | #220 | Poor 12.3% |
| Guamanians/Chamorros | 11.3 /100 | #221 | Poor 12.3% |
| Bangladeshis | 10.5 /100 | #222 | Poor 12.3% |
| Scandinavians | 10.4 /100 | #223 | Poor 12.3% |
| Immigrants | Azores | 9.7 /100 | #224 | Tragic 12.3% |
| Belgians | 9.7 /100 | #225 | Tragic 12.3% |
Demographics Similar to Sub-Saharan Africans by Divorced or Separated
In terms of divorced or separated, the demographic groups most similar to Sub-Saharan Africans are Delaware (12.7%, a difference of 0.010%), Nonimmigrants (12.8%, a difference of 0.10%), Pueblo (12.7%, a difference of 0.12%), French (12.8%, a difference of 0.14%), and Immigrants from Zaire (12.7%, a difference of 0.16%).
| Demographics | Rating | Rank | Divorced or Separated |
| Central American Indians | 0.3 /100 | #275 | Tragic 12.7% |
| Spaniards | 0.2 /100 | #276 | Tragic 12.7% |
| Dominicans | 0.2 /100 | #277 | Tragic 12.7% |
| Lumbee | 0.2 /100 | #278 | Tragic 12.7% |
| Immigrants | Dominican Republic | 0.2 /100 | #279 | Tragic 12.7% |
| Immigrants | Zaire | 0.2 /100 | #280 | Tragic 12.7% |
| Pueblo | 0.2 /100 | #281 | Tragic 12.7% |
| Sub-Saharan Africans | 0.1 /100 | #282 | Tragic 12.7% |
| Delaware | 0.1 /100 | #283 | Tragic 12.7% |
| Immigrants | Nonimmigrants | 0.1 /100 | #284 | Tragic 12.8% |
| French | 0.1 /100 | #285 | Tragic 12.8% |
| Spanish | 0.1 /100 | #286 | Tragic 12.8% |
| Hondurans | 0.1 /100 | #287 | Tragic 12.8% |
| French Canadians | 0.1 /100 | #288 | Tragic 12.8% |
| Iroquois | 0.0 /100 | #289 | Tragic 12.9% |