Fijian vs Immigrants from Poland Divorced or Separated
COMPARE
Fijian
Immigrants from Poland
Divorced or Separated
Divorced or Separated Comparison
Fijians
Immigrants from Poland
12.6%
DIVORCED OR SEPARATED
0.4/ 100
METRIC RATING
268th/ 347
METRIC RANK
11.2%
DIVORCED OR SEPARATED
100.0/ 100
METRIC RATING
47th/ 347
METRIC RANK
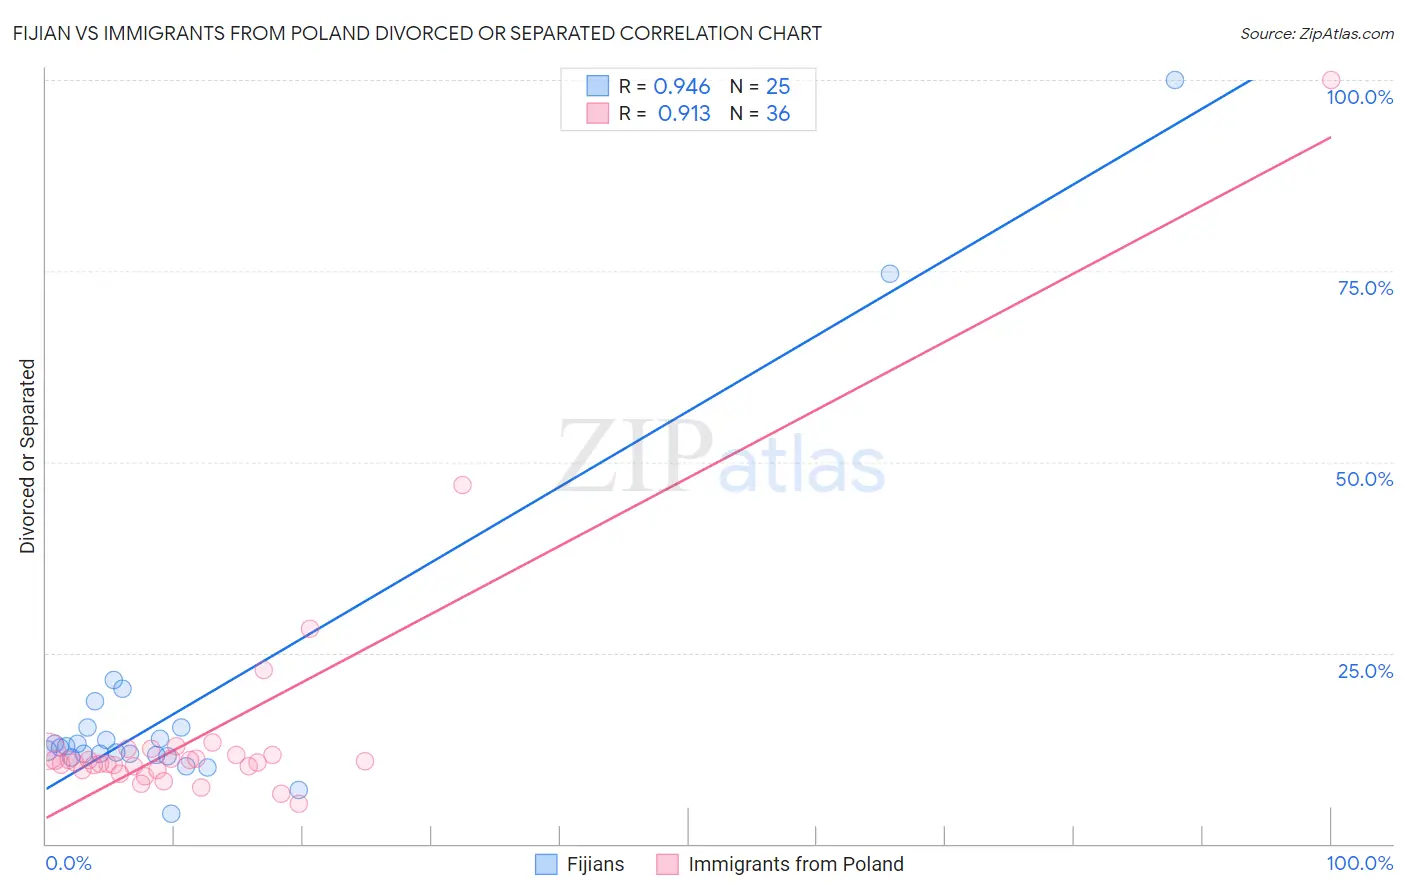
Fijian vs Immigrants from Poland Divorced or Separated Correlation Chart
The statistical analysis conducted on geographies consisting of 55,948,408 people shows a near-perfect positive correlation between the proportion of Fijians and percentage of population currently divorced or separated in the United States with a correlation coefficient (R) of 0.946 and weighted average of 12.6%. Similarly, the statistical analysis conducted on geographies consisting of 304,831,025 people shows a near-perfect positive correlation between the proportion of Immigrants from Poland and percentage of population currently divorced or separated in the United States with a correlation coefficient (R) of 0.913 and weighted average of 11.2%, a difference of 12.7%.
Divorced or Separated Correlation Summary
| Measurement | Fijian | Immigrants from Poland |
| Minimum | 4.0% | 5.2% |
| Maximum | 100.0% | 100.0% |
| Range | 96.0% | 94.8% |
| Mean | 18.8% | 14.6% |
| Median | 12.6% | 10.7% |
| Interquartile 25% (IQ1) | 11.6% | 9.9% |
| Interquartile 75% (IQ3) | 15.3% | 11.9% |
| Interquartile Range (IQR) | 3.7% | 2.0% |
| Standard Deviation (Sample) | 21.3% | 16.3% |
| Standard Deviation (Population) | 20.8% | 16.1% |
Similar Demographics by Divorced or Separated
Demographics Similar to Fijians by Divorced or Separated
In terms of divorced or separated, the demographic groups most similar to Fijians are Scottish (12.6%, a difference of 0.010%), Immigrants from Liberia (12.6%, a difference of 0.010%), White/Caucasian (12.6%, a difference of 0.060%), Immigrants from Senegal (12.6%, a difference of 0.070%), and English (12.6%, a difference of 0.080%).
| Demographics | Rating | Rank | Divorced or Separated |
| Immigrants | Dominica | 0.5 /100 | #261 | Tragic 12.6% |
| Basques | 0.5 /100 | #262 | Tragic 12.6% |
| Immigrants | Panama | 0.5 /100 | #263 | Tragic 12.6% |
| English | 0.5 /100 | #264 | Tragic 12.6% |
| Immigrants | Senegal | 0.5 /100 | #265 | Tragic 12.6% |
| Whites/Caucasians | 0.5 /100 | #266 | Tragic 12.6% |
| Scottish | 0.4 /100 | #267 | Tragic 12.6% |
| Fijians | 0.4 /100 | #268 | Tragic 12.6% |
| Immigrants | Liberia | 0.4 /100 | #269 | Tragic 12.6% |
| Ute | 0.4 /100 | #270 | Tragic 12.6% |
| Panamanians | 0.3 /100 | #271 | Tragic 12.7% |
| Immigrants | Middle Africa | 0.3 /100 | #272 | Tragic 12.7% |
| Immigrants | Micronesia | 0.3 /100 | #273 | Tragic 12.7% |
| Bermudans | 0.3 /100 | #274 | Tragic 12.7% |
| Central American Indians | 0.3 /100 | #275 | Tragic 12.7% |
Demographics Similar to Immigrants from Poland by Divorced or Separated
In terms of divorced or separated, the demographic groups most similar to Immigrants from Poland are Laotian (11.2%, a difference of 0.010%), Immigrants from Turkey (11.2%, a difference of 0.030%), Immigrants from Saudi Arabia (11.2%, a difference of 0.040%), Bolivian (11.2%, a difference of 0.10%), and Turkish (11.2%, a difference of 0.12%).
| Demographics | Rating | Rank | Divorced or Separated |
| Soviet Union | 100.0 /100 | #40 | Exceptional 11.1% |
| Bhutanese | 100.0 /100 | #41 | Exceptional 11.2% |
| Chinese | 100.0 /100 | #42 | Exceptional 11.2% |
| Immigrants | Belarus | 100.0 /100 | #43 | Exceptional 11.2% |
| Immigrants | Western Asia | 100.0 /100 | #44 | Exceptional 11.2% |
| Turks | 100.0 /100 | #45 | Exceptional 11.2% |
| Laotians | 100.0 /100 | #46 | Exceptional 11.2% |
| Immigrants | Poland | 100.0 /100 | #47 | Exceptional 11.2% |
| Immigrants | Turkey | 100.0 /100 | #48 | Exceptional 11.2% |
| Immigrants | Saudi Arabia | 100.0 /100 | #49 | Exceptional 11.2% |
| Bolivians | 100.0 /100 | #50 | Exceptional 11.2% |
| Immigrants | Bolivia | 100.0 /100 | #51 | Exceptional 11.3% |
| Immigrants | Australia | 99.9 /100 | #52 | Exceptional 11.3% |
| Immigrants | Lithuania | 99.9 /100 | #53 | Exceptional 11.3% |
| Eastern Europeans | 99.9 /100 | #54 | Exceptional 11.3% |