Fijian vs Immigrants from India Divorced or Separated
COMPARE
Fijian
Immigrants from India
Divorced or Separated
Divorced or Separated Comparison
Fijians
Immigrants from India
12.6%
DIVORCED OR SEPARATED
0.4/ 100
METRIC RATING
268th/ 347
METRIC RANK
10.1%
DIVORCED OR SEPARATED
100.0/ 100
METRIC RATING
5th/ 347
METRIC RANK
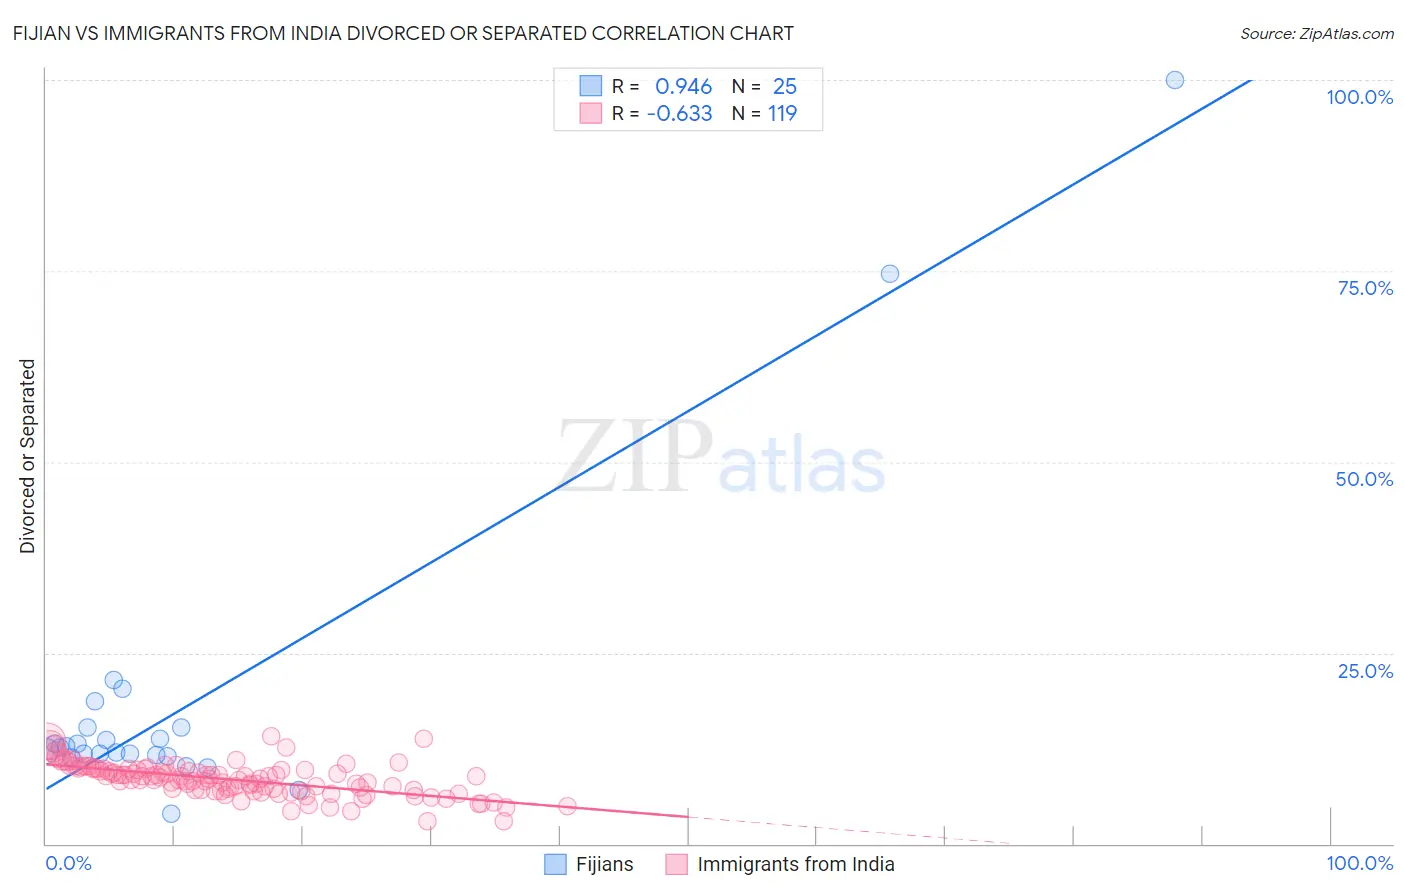
Fijian vs Immigrants from India Divorced or Separated Correlation Chart
The statistical analysis conducted on geographies consisting of 55,948,408 people shows a near-perfect positive correlation between the proportion of Fijians and percentage of population currently divorced or separated in the United States with a correlation coefficient (R) of 0.946 and weighted average of 12.6%. Similarly, the statistical analysis conducted on geographies consisting of 433,839,152 people shows a significant negative correlation between the proportion of Immigrants from India and percentage of population currently divorced or separated in the United States with a correlation coefficient (R) of -0.633 and weighted average of 10.1%, a difference of 25.5%.
Divorced or Separated Correlation Summary
| Measurement | Fijian | Immigrants from India |
| Minimum | 4.0% | 2.9% |
| Maximum | 100.0% | 14.0% |
| Range | 96.0% | 11.1% |
| Mean | 18.8% | 8.4% |
| Median | 12.6% | 8.7% |
| Interquartile 25% (IQ1) | 11.6% | 7.0% |
| Interquartile 75% (IQ3) | 15.3% | 9.8% |
| Interquartile Range (IQR) | 3.7% | 2.8% |
| Standard Deviation (Sample) | 21.3% | 2.1% |
| Standard Deviation (Population) | 20.8% | 2.1% |
Similar Demographics by Divorced or Separated
Demographics Similar to Fijians by Divorced or Separated
In terms of divorced or separated, the demographic groups most similar to Fijians are Scottish (12.6%, a difference of 0.010%), Immigrants from Liberia (12.6%, a difference of 0.010%), White/Caucasian (12.6%, a difference of 0.060%), Immigrants from Senegal (12.6%, a difference of 0.070%), and English (12.6%, a difference of 0.080%).
| Demographics | Rating | Rank | Divorced or Separated |
| Immigrants | Dominica | 0.5 /100 | #261 | Tragic 12.6% |
| Basques | 0.5 /100 | #262 | Tragic 12.6% |
| Immigrants | Panama | 0.5 /100 | #263 | Tragic 12.6% |
| English | 0.5 /100 | #264 | Tragic 12.6% |
| Immigrants | Senegal | 0.5 /100 | #265 | Tragic 12.6% |
| Whites/Caucasians | 0.5 /100 | #266 | Tragic 12.6% |
| Scottish | 0.4 /100 | #267 | Tragic 12.6% |
| Fijians | 0.4 /100 | #268 | Tragic 12.6% |
| Immigrants | Liberia | 0.4 /100 | #269 | Tragic 12.6% |
| Ute | 0.4 /100 | #270 | Tragic 12.6% |
| Panamanians | 0.3 /100 | #271 | Tragic 12.7% |
| Immigrants | Middle Africa | 0.3 /100 | #272 | Tragic 12.7% |
| Immigrants | Micronesia | 0.3 /100 | #273 | Tragic 12.7% |
| Bermudans | 0.3 /100 | #274 | Tragic 12.7% |
| Central American Indians | 0.3 /100 | #275 | Tragic 12.7% |
Demographics Similar to Immigrants from India by Divorced or Separated
In terms of divorced or separated, the demographic groups most similar to Immigrants from India are Immigrants from China (10.0%, a difference of 0.23%), Immigrants from Hong Kong (10.0%, a difference of 0.96%), Indian (Asian) (10.2%, a difference of 1.3%), Thai (10.2%, a difference of 1.4%), and Filipino (9.9%, a difference of 1.5%).
| Demographics | Rating | Rank | Divorced or Separated |
| Immigrants | Taiwan | 100.0 /100 | #1 | Exceptional 9.8% |
| Filipinos | 100.0 /100 | #2 | Exceptional 9.9% |
| Immigrants | Hong Kong | 100.0 /100 | #3 | Exceptional 10.0% |
| Immigrants | China | 100.0 /100 | #4 | Exceptional 10.0% |
| Immigrants | India | 100.0 /100 | #5 | Exceptional 10.1% |
| Indians (Asian) | 100.0 /100 | #6 | Exceptional 10.2% |
| Thais | 100.0 /100 | #7 | Exceptional 10.2% |
| Immigrants | Eastern Asia | 100.0 /100 | #8 | Exceptional 10.2% |
| Yup'ik | 100.0 /100 | #9 | Exceptional 10.3% |
| Immigrants | Singapore | 100.0 /100 | #10 | Exceptional 10.3% |
| Immigrants | South Central Asia | 100.0 /100 | #11 | Exceptional 10.4% |
| Okinawans | 100.0 /100 | #12 | Exceptional 10.5% |
| Cypriots | 100.0 /100 | #13 | Exceptional 10.5% |
| Assyrians/Chaldeans/Syriacs | 100.0 /100 | #14 | Exceptional 10.6% |
| Immigrants | Armenia | 100.0 /100 | #15 | Exceptional 10.6% |