Immigrants from Thailand vs Subsaharan African Divorced or Separated
COMPARE
Immigrants from Thailand
Subsaharan African
Divorced or Separated
Divorced or Separated Comparison
Immigrants from Thailand
Sub-Saharan Africans
12.1%
DIVORCED OR SEPARATED
32.5/ 100
METRIC RATING
193rd/ 347
METRIC RANK
12.7%
DIVORCED OR SEPARATED
0.1/ 100
METRIC RATING
282nd/ 347
METRIC RANK
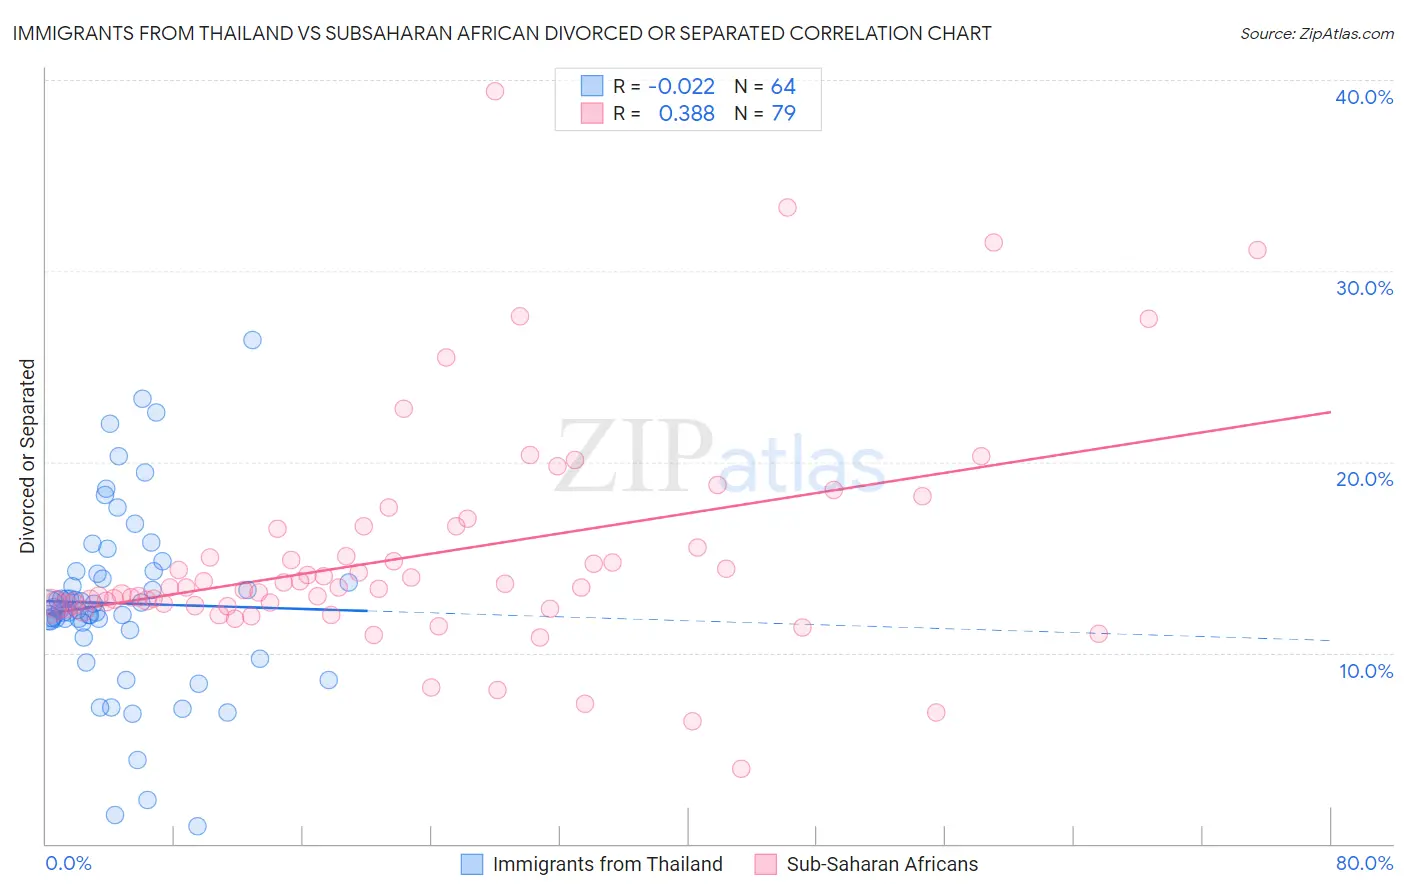
Immigrants from Thailand vs Subsaharan African Divorced or Separated Correlation Chart
The statistical analysis conducted on geographies consisting of 316,951,219 people shows no correlation between the proportion of Immigrants from Thailand and percentage of population currently divorced or separated in the United States with a correlation coefficient (R) of -0.022 and weighted average of 12.1%. Similarly, the statistical analysis conducted on geographies consisting of 507,827,607 people shows a mild positive correlation between the proportion of Sub-Saharan Africans and percentage of population currently divorced or separated in the United States with a correlation coefficient (R) of 0.388 and weighted average of 12.7%, a difference of 5.0%.
Divorced or Separated Correlation Summary
| Measurement | Immigrants from Thailand | Subsaharan African |
| Minimum | 0.90% | 3.9% |
| Maximum | 26.4% | 39.4% |
| Range | 25.5% | 35.5% |
| Mean | 12.6% | 15.1% |
| Median | 12.3% | 13.4% |
| Interquartile 25% (IQ1) | 11.4% | 12.5% |
| Interquartile 75% (IQ3) | 14.2% | 16.5% |
| Interquartile Range (IQR) | 2.8% | 4.0% |
| Standard Deviation (Sample) | 4.8% | 6.0% |
| Standard Deviation (Population) | 4.7% | 5.9% |
Similar Demographics by Divorced or Separated
Demographics Similar to Immigrants from Thailand by Divorced or Separated
In terms of divorced or separated, the demographic groups most similar to Immigrants from Thailand are Immigrants from Eritrea (12.1%, a difference of 0.020%), Norwegian (12.1%, a difference of 0.030%), Immigrants from England (12.1%, a difference of 0.040%), Swedish (12.1%, a difference of 0.070%), and Immigrants from Burma/Myanmar (12.1%, a difference of 0.080%).
| Demographics | Rating | Rank | Divorced or Separated |
| Immigrants | Chile | 39.0 /100 | #186 | Fair 12.1% |
| Belizeans | 37.7 /100 | #187 | Fair 12.1% |
| Immigrants | Belize | 37.6 /100 | #188 | Fair 12.1% |
| Sierra Leoneans | 35.5 /100 | #189 | Fair 12.1% |
| Moroccans | 34.8 /100 | #190 | Fair 12.1% |
| Swedes | 34.4 /100 | #191 | Fair 12.1% |
| Norwegians | 33.2 /100 | #192 | Fair 12.1% |
| Immigrants | Thailand | 32.5 /100 | #193 | Fair 12.1% |
| Immigrants | Eritrea | 31.9 /100 | #194 | Fair 12.1% |
| Immigrants | England | 31.4 /100 | #195 | Fair 12.1% |
| Immigrants | Burma/Myanmar | 30.4 /100 | #196 | Fair 12.1% |
| Immigrants | Africa | 30.3 /100 | #197 | Fair 12.1% |
| Nigerians | 30.1 /100 | #198 | Fair 12.1% |
| Central Americans | 29.4 /100 | #199 | Fair 12.1% |
| South Americans | 28.6 /100 | #200 | Fair 12.2% |
Demographics Similar to Sub-Saharan Africans by Divorced or Separated
In terms of divorced or separated, the demographic groups most similar to Sub-Saharan Africans are Delaware (12.7%, a difference of 0.010%), Nonimmigrants (12.8%, a difference of 0.10%), Pueblo (12.7%, a difference of 0.12%), French (12.8%, a difference of 0.14%), and Immigrants from Zaire (12.7%, a difference of 0.16%).
| Demographics | Rating | Rank | Divorced or Separated |
| Central American Indians | 0.3 /100 | #275 | Tragic 12.7% |
| Spaniards | 0.2 /100 | #276 | Tragic 12.7% |
| Dominicans | 0.2 /100 | #277 | Tragic 12.7% |
| Lumbee | 0.2 /100 | #278 | Tragic 12.7% |
| Immigrants | Dominican Republic | 0.2 /100 | #279 | Tragic 12.7% |
| Immigrants | Zaire | 0.2 /100 | #280 | Tragic 12.7% |
| Pueblo | 0.2 /100 | #281 | Tragic 12.7% |
| Sub-Saharan Africans | 0.1 /100 | #282 | Tragic 12.7% |
| Delaware | 0.1 /100 | #283 | Tragic 12.7% |
| Immigrants | Nonimmigrants | 0.1 /100 | #284 | Tragic 12.8% |
| French | 0.1 /100 | #285 | Tragic 12.8% |
| Spanish | 0.1 /100 | #286 | Tragic 12.8% |
| Hondurans | 0.1 /100 | #287 | Tragic 12.8% |
| French Canadians | 0.1 /100 | #288 | Tragic 12.8% |
| Iroquois | 0.0 /100 | #289 | Tragic 12.9% |