Fijian vs Comanche Married-couple Households
COMPARE
Fijian
Comanche
Married-couple Households
Married-couple Households Comparison
Fijians
Comanche
46.1%
MARRIED-COUPLE HOUSEHOLDS
29.2/ 100
METRIC RATING
187th/ 347
METRIC RANK
44.5%
MARRIED-COUPLE HOUSEHOLDS
1.2/ 100
METRIC RATING
237th/ 347
METRIC RANK
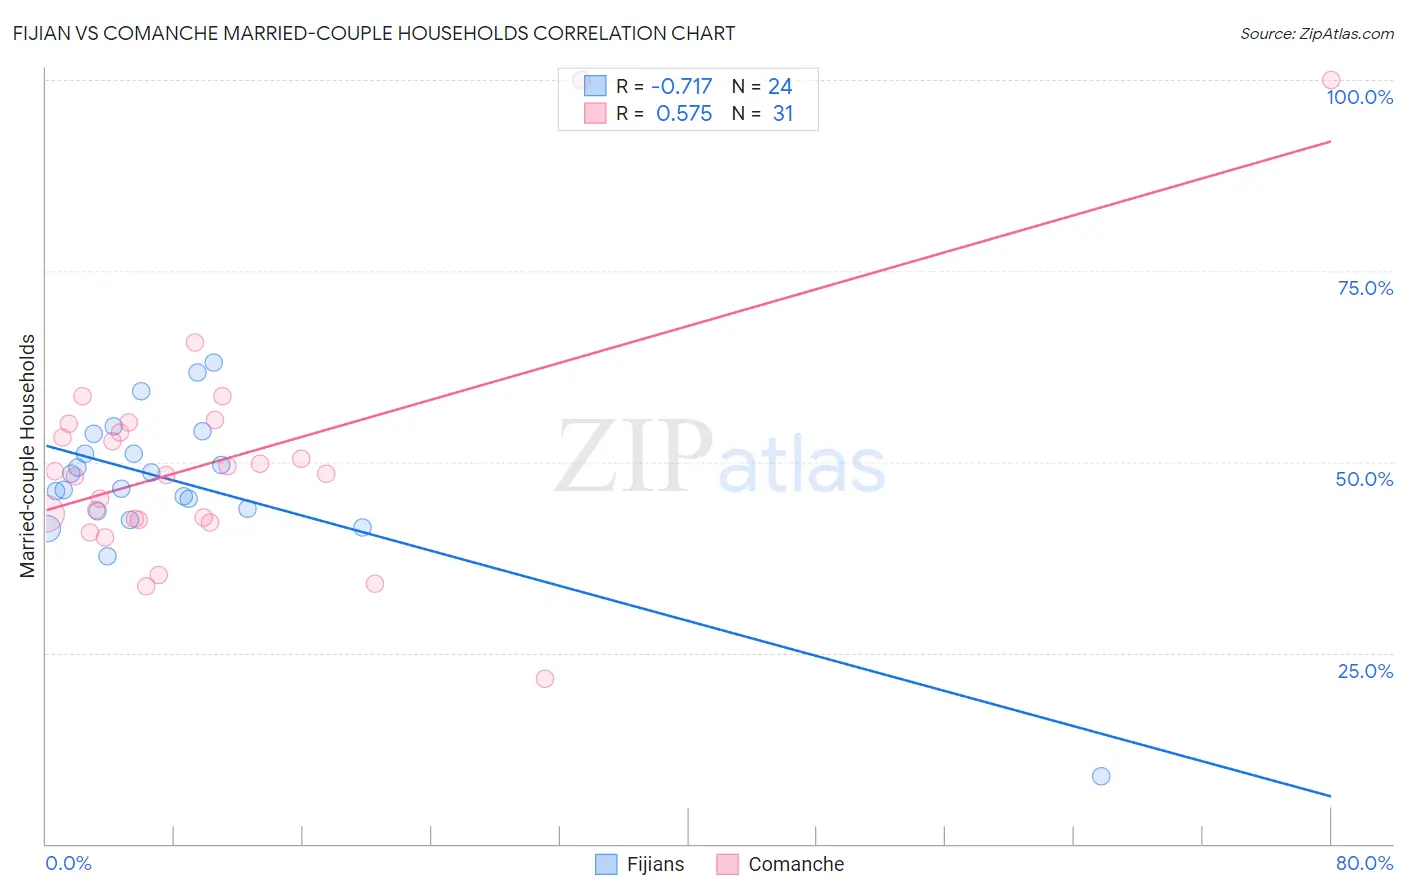
Fijian vs Comanche Married-couple Households Correlation Chart
The statistical analysis conducted on geographies consisting of 55,947,966 people shows a strong negative correlation between the proportion of Fijians and percentage of married-couple family households in the United States with a correlation coefficient (R) of -0.717 and weighted average of 46.1%. Similarly, the statistical analysis conducted on geographies consisting of 109,768,112 people shows a substantial positive correlation between the proportion of Comanche and percentage of married-couple family households in the United States with a correlation coefficient (R) of 0.575 and weighted average of 44.5%, a difference of 3.5%.
Married-couple Households Correlation Summary
| Measurement | Fijian | Comanche |
| Minimum | 8.8% | 21.6% |
| Maximum | 63.0% | 100.0% |
| Range | 54.2% | 78.4% |
| Mean | 47.2% | 50.3% |
| Median | 47.5% | 48.4% |
| Interquartile 25% (IQ1) | 43.7% | 42.4% |
| Interquartile 75% (IQ3) | 52.4% | 55.0% |
| Interquartile Range (IQR) | 8.7% | 12.6% |
| Standard Deviation (Sample) | 10.4% | 15.9% |
| Standard Deviation (Population) | 10.2% | 15.6% |
Similar Demographics by Married-couple Households
Demographics Similar to Fijians by Married-couple Households
In terms of married-couple households, the demographic groups most similar to Fijians are South American Indian (46.0%, a difference of 0.040%), Albanian (46.1%, a difference of 0.080%), Immigrants from Latvia (46.0%, a difference of 0.11%), Immigrants from Kuwait (46.0%, a difference of 0.18%), and Choctaw (46.0%, a difference of 0.21%).
| Demographics | Rating | Rank | Married-couple Households |
| Mongolians | 42.0 /100 | #180 | Average 46.3% |
| Malaysians | 41.8 /100 | #181 | Average 46.3% |
| Yugoslavians | 38.9 /100 | #182 | Fair 46.2% |
| Immigrants | Brazil | 38.3 /100 | #183 | Fair 46.2% |
| Immigrants | Switzerland | 36.9 /100 | #184 | Fair 46.2% |
| Brazilians | 35.9 /100 | #185 | Fair 46.2% |
| Albanians | 31.1 /100 | #186 | Fair 46.1% |
| Fijians | 29.2 /100 | #187 | Fair 46.1% |
| South American Indians | 28.4 /100 | #188 | Fair 46.0% |
| Immigrants | Latvia | 26.9 /100 | #189 | Fair 46.0% |
| Immigrants | Kuwait | 25.6 /100 | #190 | Fair 46.0% |
| Choctaw | 24.9 /100 | #191 | Fair 46.0% |
| Immigrants | Northern Africa | 24.6 /100 | #192 | Fair 46.0% |
| Taiwanese | 23.4 /100 | #193 | Fair 45.9% |
| Mexican American Indians | 23.3 /100 | #194 | Fair 45.9% |
Demographics Similar to Comanche by Married-couple Households
In terms of married-couple households, the demographic groups most similar to Comanche are Yaqui (44.5%, a difference of 0.030%), Immigrants from Nicaragua (44.5%, a difference of 0.040%), Immigrants from Uruguay (44.5%, a difference of 0.050%), Spanish American (44.5%, a difference of 0.070%), and Immigrants from Panama (44.6%, a difference of 0.11%).
| Demographics | Rating | Rank | Married-couple Households |
| Soviet Union | 1.6 /100 | #230 | Tragic 44.6% |
| Houma | 1.5 /100 | #231 | Tragic 44.6% |
| Marshallese | 1.5 /100 | #232 | Tragic 44.6% |
| Immigrants | Uganda | 1.5 /100 | #233 | Tragic 44.6% |
| Immigrants | Panama | 1.3 /100 | #234 | Tragic 44.6% |
| Immigrants | Nicaragua | 1.2 /100 | #235 | Tragic 44.5% |
| Yaqui | 1.2 /100 | #236 | Tragic 44.5% |
| Comanche | 1.2 /100 | #237 | Tragic 44.5% |
| Immigrants | Uruguay | 1.1 /100 | #238 | Tragic 44.5% |
| Spanish Americans | 1.1 /100 | #239 | Tragic 44.5% |
| Ute | 1.0 /100 | #240 | Tragic 44.4% |
| Immigrants | Bosnia and Herzegovina | 1.0 /100 | #241 | Tragic 44.4% |
| Immigrants | Albania | 1.0 /100 | #242 | Tragic 44.4% |
| Immigrants | Saudi Arabia | 0.9 /100 | #243 | Tragic 44.4% |
| Immigrants | Armenia | 0.7 /100 | #244 | Tragic 44.3% |