Immigrants from Sri Lanka vs Comanche Married-couple Households
COMPARE
Immigrants from Sri Lanka
Comanche
Married-couple Households
Married-couple Households Comparison
Immigrants from Sri Lanka
Comanche
48.7%
MARRIED-COUPLE HOUSEHOLDS
99.4/ 100
METRIC RATING
49th/ 347
METRIC RANK
44.5%
MARRIED-COUPLE HOUSEHOLDS
1.2/ 100
METRIC RATING
237th/ 347
METRIC RANK
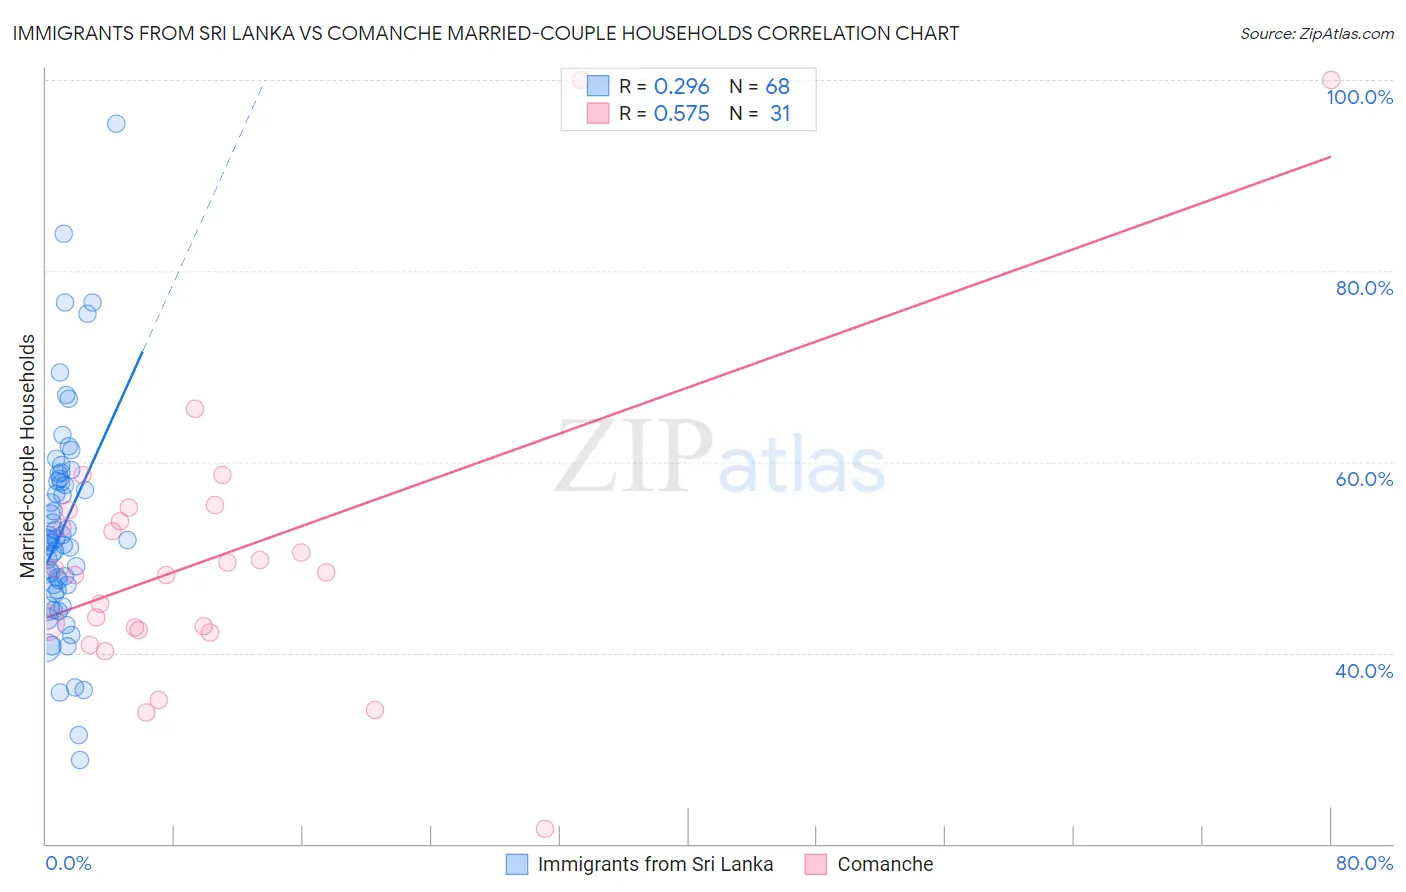
Immigrants from Sri Lanka vs Comanche Married-couple Households Correlation Chart
The statistical analysis conducted on geographies consisting of 149,682,536 people shows a weak positive correlation between the proportion of Immigrants from Sri Lanka and percentage of married-couple family households in the United States with a correlation coefficient (R) of 0.296 and weighted average of 48.7%. Similarly, the statistical analysis conducted on geographies consisting of 109,768,112 people shows a substantial positive correlation between the proportion of Comanche and percentage of married-couple family households in the United States with a correlation coefficient (R) of 0.575 and weighted average of 44.5%, a difference of 9.4%.
Married-couple Households Correlation Summary
| Measurement | Immigrants from Sri Lanka | Comanche |
| Minimum | 28.8% | 21.6% |
| Maximum | 95.4% | 100.0% |
| Range | 66.7% | 78.4% |
| Mean | 53.1% | 50.3% |
| Median | 51.8% | 48.4% |
| Interquartile 25% (IQ1) | 46.8% | 42.4% |
| Interquartile 75% (IQ3) | 58.1% | 55.0% |
| Interquartile Range (IQR) | 11.3% | 12.6% |
| Standard Deviation (Sample) | 11.6% | 15.9% |
| Standard Deviation (Population) | 11.5% | 15.6% |
Similar Demographics by Married-couple Households
Demographics Similar to Immigrants from Sri Lanka by Married-couple Households
In terms of married-couple households, the demographic groups most similar to Immigrants from Sri Lanka are Samoan (48.7%, a difference of 0.040%), Indian (Asian) (48.7%, a difference of 0.060%), Eastern European (48.6%, a difference of 0.080%), British (48.7%, a difference of 0.12%), and Irish (48.6%, a difference of 0.12%).
| Demographics | Rating | Rank | Married-couple Households |
| Immigrants | Vietnam | 99.6 /100 | #42 | Exceptional 48.8% |
| Immigrants | Iran | 99.6 /100 | #43 | Exceptional 48.8% |
| Welsh | 99.5 /100 | #44 | Exceptional 48.8% |
| Immigrants | Eastern Asia | 99.5 /100 | #45 | Exceptional 48.8% |
| Tsimshian | 99.5 /100 | #46 | Exceptional 48.7% |
| British | 99.5 /100 | #47 | Exceptional 48.7% |
| Indians (Asian) | 99.4 /100 | #48 | Exceptional 48.7% |
| Immigrants | Sri Lanka | 99.4 /100 | #49 | Exceptional 48.7% |
| Samoans | 99.4 /100 | #50 | Exceptional 48.7% |
| Eastern Europeans | 99.3 /100 | #51 | Exceptional 48.6% |
| Irish | 99.3 /100 | #52 | Exceptional 48.6% |
| Whites/Caucasians | 99.3 /100 | #53 | Exceptional 48.6% |
| Immigrants | Lithuania | 99.3 /100 | #54 | Exceptional 48.6% |
| Austrians | 99.3 /100 | #55 | Exceptional 48.6% |
| Immigrants | Northern Europe | 99.3 /100 | #56 | Exceptional 48.6% |
Demographics Similar to Comanche by Married-couple Households
In terms of married-couple households, the demographic groups most similar to Comanche are Yaqui (44.5%, a difference of 0.030%), Immigrants from Nicaragua (44.5%, a difference of 0.040%), Immigrants from Uruguay (44.5%, a difference of 0.050%), Spanish American (44.5%, a difference of 0.070%), and Immigrants from Panama (44.6%, a difference of 0.11%).
| Demographics | Rating | Rank | Married-couple Households |
| Soviet Union | 1.6 /100 | #230 | Tragic 44.6% |
| Houma | 1.5 /100 | #231 | Tragic 44.6% |
| Marshallese | 1.5 /100 | #232 | Tragic 44.6% |
| Immigrants | Uganda | 1.5 /100 | #233 | Tragic 44.6% |
| Immigrants | Panama | 1.3 /100 | #234 | Tragic 44.6% |
| Immigrants | Nicaragua | 1.2 /100 | #235 | Tragic 44.5% |
| Yaqui | 1.2 /100 | #236 | Tragic 44.5% |
| Comanche | 1.2 /100 | #237 | Tragic 44.5% |
| Immigrants | Uruguay | 1.1 /100 | #238 | Tragic 44.5% |
| Spanish Americans | 1.1 /100 | #239 | Tragic 44.5% |
| Ute | 1.0 /100 | #240 | Tragic 44.4% |
| Immigrants | Bosnia and Herzegovina | 1.0 /100 | #241 | Tragic 44.4% |
| Immigrants | Albania | 1.0 /100 | #242 | Tragic 44.4% |
| Immigrants | Saudi Arabia | 0.9 /100 | #243 | Tragic 44.4% |
| Immigrants | Armenia | 0.7 /100 | #244 | Tragic 44.3% |