European vs Immigrants from Northern Africa Average Family Size
COMPARE
European
Immigrants from Northern Africa
Average Family Size
Average Family Size Comparison
Europeans
Immigrants from Northern Africa
3.14
AVERAGE FAMILY SIZE
0.2/ 100
METRIC RATING
292nd/ 347
METRIC RANK
3.22
AVERAGE FAMILY SIZE
41.7/ 100
METRIC RATING
183rd/ 347
METRIC RANK
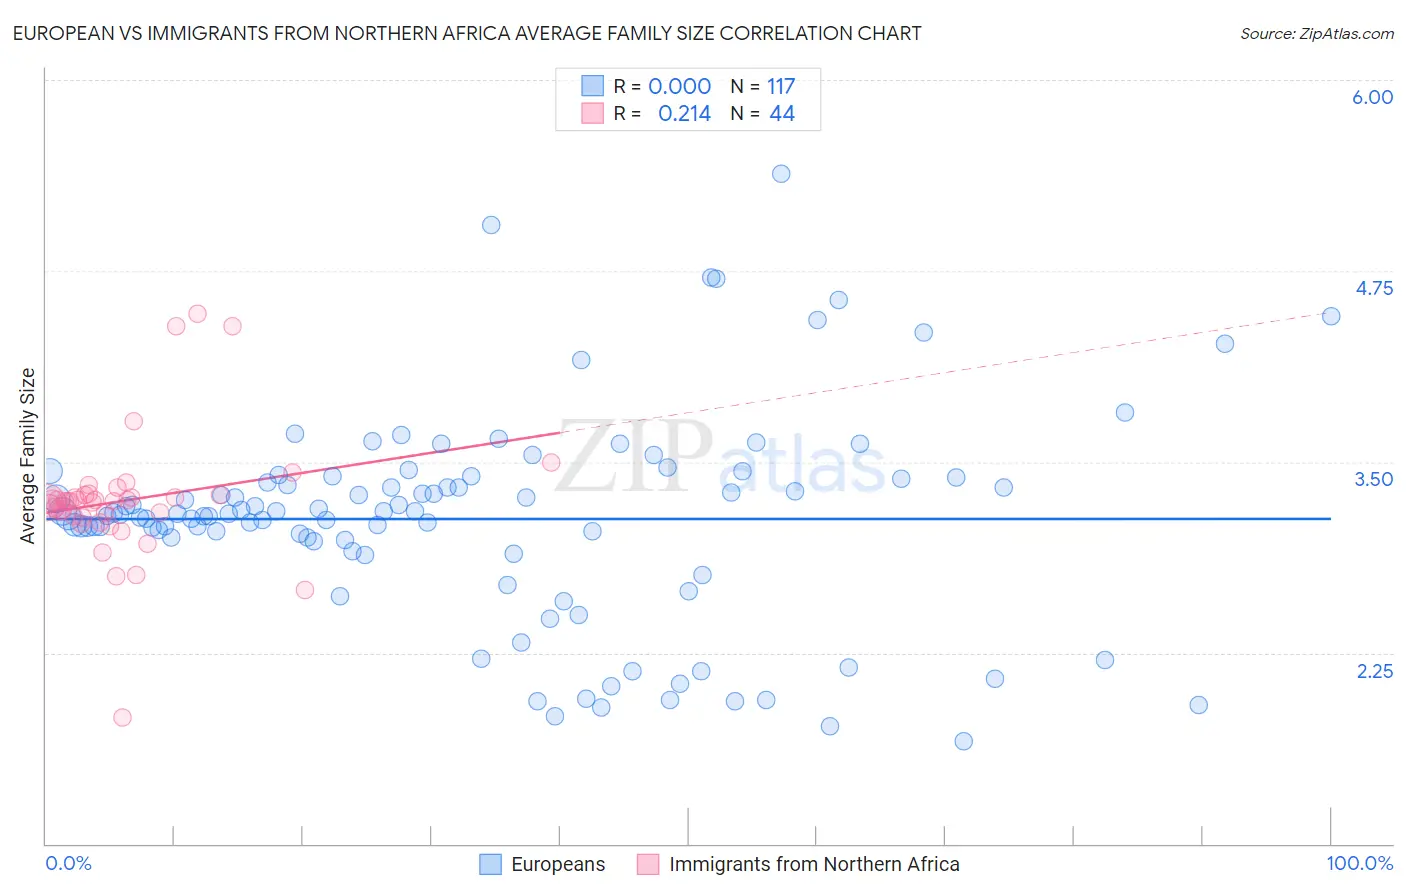
European vs Immigrants from Northern Africa Average Family Size Correlation Chart
The statistical analysis conducted on geographies consisting of 561,245,179 people shows no correlation between the proportion of Europeans and average family size in the United States with a correlation coefficient (R) of 0.000 and weighted average of 3.14. Similarly, the statistical analysis conducted on geographies consisting of 321,088,327 people shows a weak positive correlation between the proportion of Immigrants from Northern Africa and average family size in the United States with a correlation coefficient (R) of 0.214 and weighted average of 3.22, a difference of 2.7%.
Average Family Size Correlation Summary
| Measurement | European | Immigrants from Northern Africa |
| Minimum | 1.67 | 1.83 |
| Maximum | 5.39 | 4.47 |
| Range | 3.72 | 2.64 |
| Mean | 3.13 | 3.25 |
| Median | 3.16 | 3.24 |
| Interquartile 25% (IQ1) | 2.95 | 3.14 |
| Interquartile 75% (IQ3) | 3.40 | 3.28 |
| Interquartile Range (IQR) | 0.45 | 0.15 |
| Standard Deviation (Sample) | 0.68 | 0.42 |
| Standard Deviation (Population) | 0.68 | 0.42 |
Similar Demographics by Average Family Size
Demographics Similar to Europeans by Average Family Size
In terms of average family size, the demographic groups most similar to Europeans are Scandinavian (3.14, a difference of 0.010%), Alsatian (3.14, a difference of 0.020%), Immigrants from Croatia (3.14, a difference of 0.030%), Austrian (3.14, a difference of 0.030%), and Ukrainian (3.14, a difference of 0.030%).
| Demographics | Rating | Rank | Average Family Size |
| Whites/Caucasians | 0.3 /100 | #285 | Tragic 3.14 |
| Immigrants | Netherlands | 0.3 /100 | #286 | Tragic 3.14 |
| Greeks | 0.3 /100 | #287 | Tragic 3.14 |
| Immigrants | Czechoslovakia | 0.3 /100 | #288 | Tragic 3.14 |
| Immigrants | Norway | 0.3 /100 | #289 | Tragic 3.14 |
| Cypriots | 0.3 /100 | #290 | Tragic 3.14 |
| Alsatians | 0.2 /100 | #291 | Tragic 3.14 |
| Europeans | 0.2 /100 | #292 | Tragic 3.14 |
| Scandinavians | 0.2 /100 | #293 | Tragic 3.14 |
| Immigrants | Croatia | 0.2 /100 | #294 | Tragic 3.14 |
| Austrians | 0.2 /100 | #295 | Tragic 3.14 |
| Ukrainians | 0.2 /100 | #296 | Tragic 3.14 |
| Immigrants | Western Europe | 0.2 /100 | #297 | Tragic 3.14 |
| Colville | 0.2 /100 | #298 | Tragic 3.14 |
| Canadians | 0.2 /100 | #299 | Tragic 3.14 |
Demographics Similar to Immigrants from Northern Africa by Average Family Size
In terms of average family size, the demographic groups most similar to Immigrants from Northern Africa are Immigrants from Eastern Asia (3.22, a difference of 0.020%), Immigrants from Sri Lanka (3.22, a difference of 0.040%), Immigrants from Argentina (3.22, a difference of 0.040%), Moroccan (3.22, a difference of 0.050%), and Immigrants from Malaysia (3.22, a difference of 0.050%).
| Demographics | Rating | Rank | Average Family Size |
| Israelis | 48.7 /100 | #176 | Average 3.23 |
| Argentineans | 47.4 /100 | #177 | Average 3.23 |
| Spaniards | 47.2 /100 | #178 | Average 3.23 |
| Immigrants | Korea | 46.9 /100 | #179 | Average 3.23 |
| Palestinians | 46.6 /100 | #180 | Average 3.23 |
| Spanish | 44.8 /100 | #181 | Average 3.23 |
| Moroccans | 44.2 /100 | #182 | Average 3.22 |
| Immigrants | Northern Africa | 41.7 /100 | #183 | Average 3.22 |
| Immigrants | Eastern Asia | 40.8 /100 | #184 | Average 3.22 |
| Immigrants | Sri Lanka | 39.8 /100 | #185 | Fair 3.22 |
| Immigrants | Argentina | 39.8 /100 | #186 | Fair 3.22 |
| Immigrants | Malaysia | 39.0 /100 | #187 | Fair 3.22 |
| Thais | 38.3 /100 | #188 | Fair 3.22 |
| Pakistanis | 33.7 /100 | #189 | Fair 3.22 |
| Burmese | 31.0 /100 | #190 | Fair 3.22 |