European vs New Zealander Average Family Size
COMPARE
European
New Zealander
Average Family Size
Average Family Size Comparison
Europeans
New Zealanders
3.14
AVERAGE FAMILY SIZE
0.2/ 100
METRIC RATING
292nd/ 347
METRIC RANK
3.15
AVERAGE FAMILY SIZE
0.6/ 100
METRIC RATING
273rd/ 347
METRIC RANK
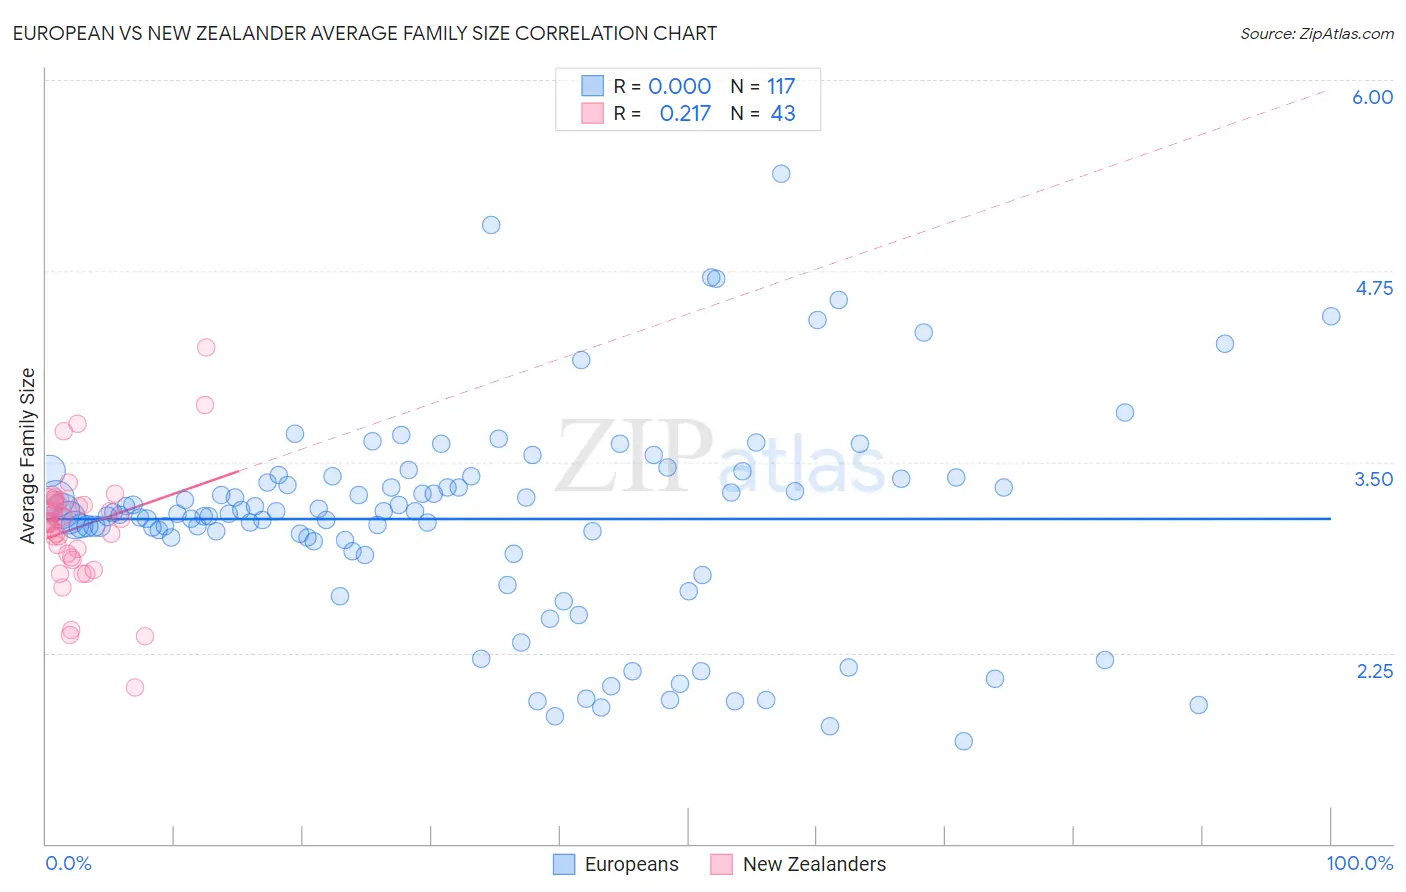
European vs New Zealander Average Family Size Correlation Chart
The statistical analysis conducted on geographies consisting of 561,245,179 people shows no correlation between the proportion of Europeans and average family size in the United States with a correlation coefficient (R) of 0.000 and weighted average of 3.14. Similarly, the statistical analysis conducted on geographies consisting of 106,893,950 people shows a weak positive correlation between the proportion of New Zealanders and average family size in the United States with a correlation coefficient (R) of 0.217 and weighted average of 3.15, a difference of 0.45%.
Average Family Size Correlation Summary
| Measurement | European | New Zealander |
| Minimum | 1.67 | 2.02 |
| Maximum | 5.39 | 4.25 |
| Range | 3.72 | 2.23 |
| Mean | 3.13 | 3.07 |
| Median | 3.16 | 3.11 |
| Interquartile 25% (IQ1) | 2.95 | 2.87 |
| Interquartile 75% (IQ3) | 3.40 | 3.22 |
| Interquartile Range (IQR) | 0.45 | 0.35 |
| Standard Deviation (Sample) | 0.68 | 0.39 |
| Standard Deviation (Population) | 0.68 | 0.39 |
Demographics Similar to Europeans and New Zealanders by Average Family Size
In terms of average family size, the demographic groups most similar to Europeans are Alsatian (3.14, a difference of 0.020%), Cypriot (3.14, a difference of 0.060%), Greek (3.14, a difference of 0.090%), Immigrants from Czechoslovakia (3.14, a difference of 0.090%), and Immigrants from Norway (3.14, a difference of 0.090%). Similarly, the demographic groups most similar to New Zealanders are Immigrants from Belgium (3.15, a difference of 0.0%), Immigrants from Lithuania (3.15, a difference of 0.010%), Cambodian (3.15, a difference of 0.010%), Immigrants from Bosnia and Herzegovina (3.15, a difference of 0.090%), and Swiss (3.15, a difference of 0.10%).
| Demographics | Rating | Rank | Average Family Size |
| Immigrants | Lithuania | 0.6 /100 | #272 | Tragic 3.15 |
| New Zealanders | 0.6 /100 | #273 | Tragic 3.15 |
| Immigrants | Belgium | 0.6 /100 | #274 | Tragic 3.15 |
| Cambodians | 0.6 /100 | #275 | Tragic 3.15 |
| Immigrants | Bosnia and Herzegovina | 0.5 /100 | #276 | Tragic 3.15 |
| Swiss | 0.5 /100 | #277 | Tragic 3.15 |
| Okinawans | 0.5 /100 | #278 | Tragic 3.15 |
| Immigrants | Europe | 0.5 /100 | #279 | Tragic 3.15 |
| Immigrants | England | 0.4 /100 | #280 | Tragic 3.15 |
| Immigrants | Denmark | 0.4 /100 | #281 | Tragic 3.15 |
| Yugoslavians | 0.4 /100 | #282 | Tragic 3.15 |
| German Russians | 0.4 /100 | #283 | Tragic 3.15 |
| Immigrants | France | 0.4 /100 | #284 | Tragic 3.15 |
| Whites/Caucasians | 0.3 /100 | #285 | Tragic 3.14 |
| Immigrants | Netherlands | 0.3 /100 | #286 | Tragic 3.14 |
| Greeks | 0.3 /100 | #287 | Tragic 3.14 |
| Immigrants | Czechoslovakia | 0.3 /100 | #288 | Tragic 3.14 |
| Immigrants | Norway | 0.3 /100 | #289 | Tragic 3.14 |
| Cypriots | 0.3 /100 | #290 | Tragic 3.14 |
| Alsatians | 0.2 /100 | #291 | Tragic 3.14 |
| Europeans | 0.2 /100 | #292 | Tragic 3.14 |