European vs Immigrants from Bosnia and Herzegovina Average Family Size
COMPARE
European
Immigrants from Bosnia and Herzegovina
Average Family Size
Average Family Size Comparison
Europeans
Immigrants from Bosnia and Herzegovina
3.14
AVERAGE FAMILY SIZE
0.2/ 100
METRIC RATING
292nd/ 347
METRIC RANK
3.15
AVERAGE FAMILY SIZE
0.5/ 100
METRIC RATING
276th/ 347
METRIC RANK
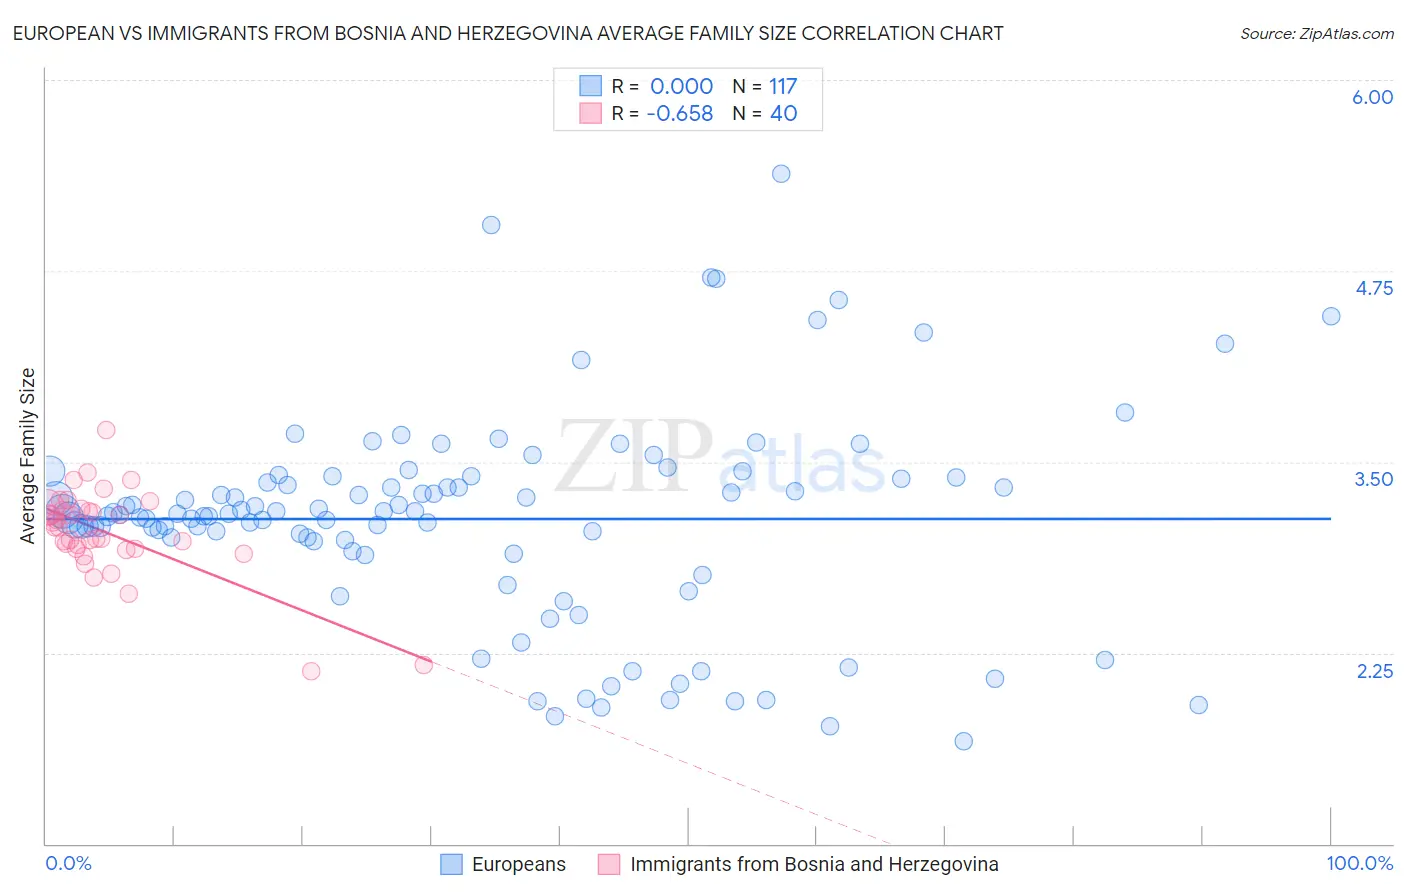
European vs Immigrants from Bosnia and Herzegovina Average Family Size Correlation Chart
The statistical analysis conducted on geographies consisting of 561,245,179 people shows no correlation between the proportion of Europeans and average family size in the United States with a correlation coefficient (R) of 0.000 and weighted average of 3.14. Similarly, the statistical analysis conducted on geographies consisting of 156,805,510 people shows a significant negative correlation between the proportion of Immigrants from Bosnia and Herzegovina and average family size in the United States with a correlation coefficient (R) of -0.658 and weighted average of 3.15, a difference of 0.37%.
Average Family Size Correlation Summary
| Measurement | European | Immigrants from Bosnia and Herzegovina |
| Minimum | 1.67 | 2.13 |
| Maximum | 5.39 | 3.71 |
| Range | 3.72 | 1.58 |
| Mean | 3.13 | 3.04 |
| Median | 3.16 | 3.07 |
| Interquartile 25% (IQ1) | 2.95 | 2.93 |
| Interquartile 75% (IQ3) | 3.40 | 3.19 |
| Interquartile Range (IQR) | 0.45 | 0.26 |
| Standard Deviation (Sample) | 0.68 | 0.29 |
| Standard Deviation (Population) | 0.68 | 0.29 |
Demographics Similar to Europeans and Immigrants from Bosnia and Herzegovina by Average Family Size
In terms of average family size, the demographic groups most similar to Europeans are Scandinavian (3.14, a difference of 0.010%), Alsatian (3.14, a difference of 0.020%), Immigrants from Croatia (3.14, a difference of 0.030%), Cypriot (3.14, a difference of 0.060%), and Greek (3.14, a difference of 0.090%). Similarly, the demographic groups most similar to Immigrants from Bosnia and Herzegovina are Swiss (3.15, a difference of 0.010%), Okinawan (3.15, a difference of 0.040%), Immigrants from Europe (3.15, a difference of 0.060%), Immigrants from Belgium (3.15, a difference of 0.080%), and Cambodian (3.15, a difference of 0.080%).
| Demographics | Rating | Rank | Average Family Size |
| Immigrants | Belgium | 0.6 /100 | #274 | Tragic 3.15 |
| Cambodians | 0.6 /100 | #275 | Tragic 3.15 |
| Immigrants | Bosnia and Herzegovina | 0.5 /100 | #276 | Tragic 3.15 |
| Swiss | 0.5 /100 | #277 | Tragic 3.15 |
| Okinawans | 0.5 /100 | #278 | Tragic 3.15 |
| Immigrants | Europe | 0.5 /100 | #279 | Tragic 3.15 |
| Immigrants | England | 0.4 /100 | #280 | Tragic 3.15 |
| Immigrants | Denmark | 0.4 /100 | #281 | Tragic 3.15 |
| Yugoslavians | 0.4 /100 | #282 | Tragic 3.15 |
| German Russians | 0.4 /100 | #283 | Tragic 3.15 |
| Immigrants | France | 0.4 /100 | #284 | Tragic 3.15 |
| Whites/Caucasians | 0.3 /100 | #285 | Tragic 3.14 |
| Immigrants | Netherlands | 0.3 /100 | #286 | Tragic 3.14 |
| Greeks | 0.3 /100 | #287 | Tragic 3.14 |
| Immigrants | Czechoslovakia | 0.3 /100 | #288 | Tragic 3.14 |
| Immigrants | Norway | 0.3 /100 | #289 | Tragic 3.14 |
| Cypriots | 0.3 /100 | #290 | Tragic 3.14 |
| Alsatians | 0.2 /100 | #291 | Tragic 3.14 |
| Europeans | 0.2 /100 | #292 | Tragic 3.14 |
| Scandinavians | 0.2 /100 | #293 | Tragic 3.14 |
| Immigrants | Croatia | 0.2 /100 | #294 | Tragic 3.14 |