Belgian vs Immigrants from Cuba Births to Unmarried Women
COMPARE
Belgian
Immigrants from Cuba
Births to Unmarried Women
Births to Unmarried Women Comparison
Belgians
Immigrants from Cuba
31.6%
BIRTHS TO UNMARRIED WOMEN
52.4/ 100
METRIC RATING
168th/ 347
METRIC RANK
41.5%
BIRTHS TO UNMARRIED WOMEN
0.0/ 100
METRIC RATING
326th/ 347
METRIC RANK
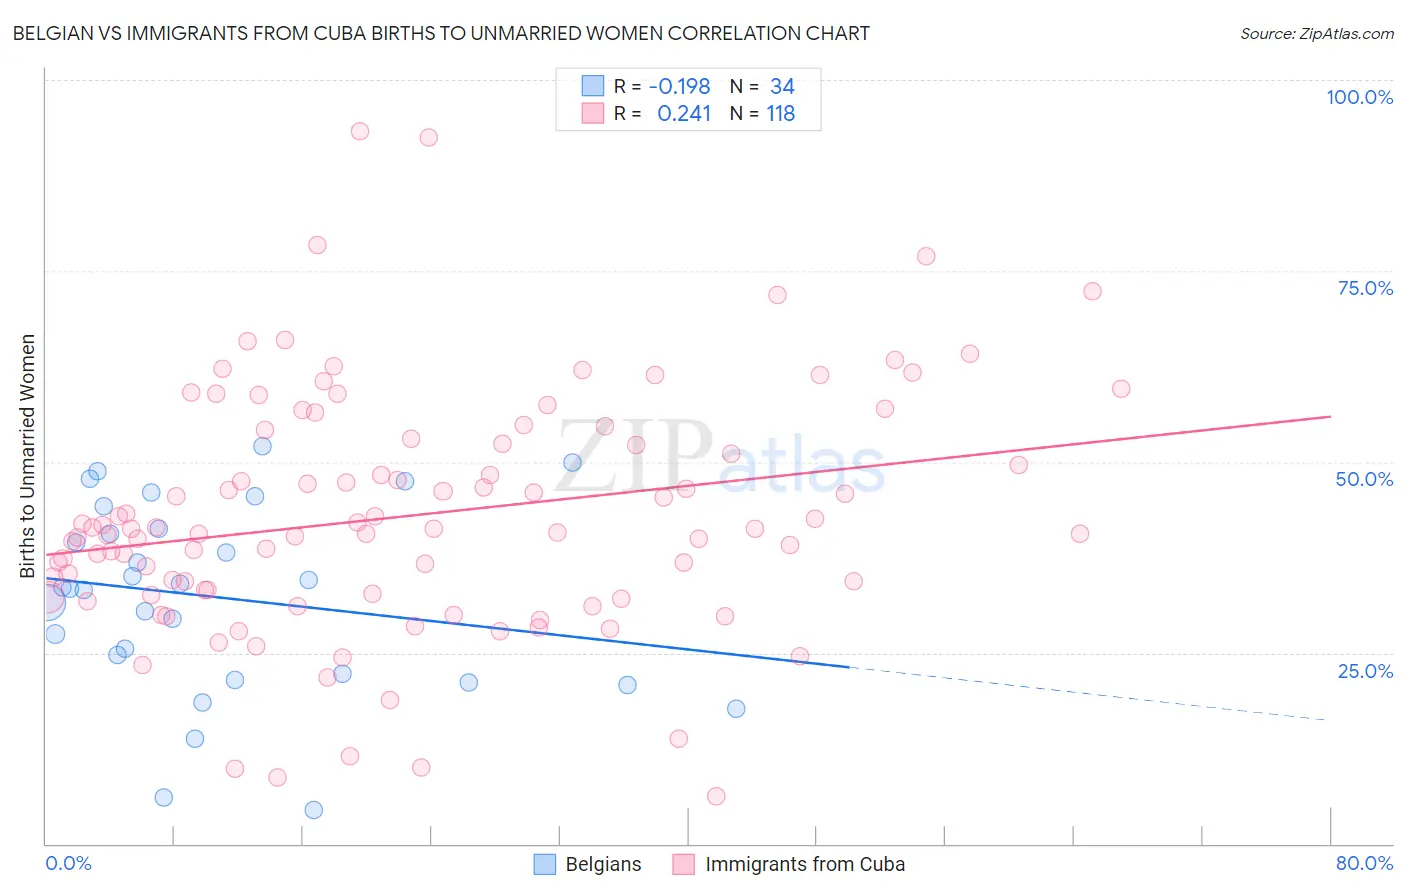
Belgian vs Immigrants from Cuba Births to Unmarried Women Correlation Chart
The statistical analysis conducted on geographies consisting of 329,841,435 people shows a poor negative correlation between the proportion of Belgians and percentage of births to unmarried women in the United States with a correlation coefficient (R) of -0.198 and weighted average of 31.6%. Similarly, the statistical analysis conducted on geographies consisting of 308,833,039 people shows a weak positive correlation between the proportion of Immigrants from Cuba and percentage of births to unmarried women in the United States with a correlation coefficient (R) of 0.241 and weighted average of 41.5%, a difference of 31.2%.
Births to Unmarried Women Correlation Summary
| Measurement | Belgian | Immigrants from Cuba |
| Minimum | 4.4% | 6.3% |
| Maximum | 52.0% | 93.3% |
| Range | 47.6% | 87.0% |
| Mean | 32.3% | 43.0% |
| Median | 33.5% | 41.2% |
| Interquartile 25% (IQ1) | 22.3% | 32.8% |
| Interquartile 75% (IQ3) | 41.2% | 53.1% |
| Interquartile Range (IQR) | 19.0% | 20.3% |
| Standard Deviation (Sample) | 12.4% | 15.9% |
| Standard Deviation (Population) | 12.2% | 15.8% |
Similar Demographics by Births to Unmarried Women
Demographics Similar to Belgians by Births to Unmarried Women
In terms of births to unmarried women, the demographic groups most similar to Belgians are Slavic (31.6%, a difference of 0.030%), Guamanian/Chamorro (31.6%, a difference of 0.10%), Finnish (31.7%, a difference of 0.18%), Immigrants from Eritrea (31.7%, a difference of 0.19%), and Immigrants from Yemen (31.7%, a difference of 0.20%).
| Demographics | Rating | Rank | Births to Unmarried Women |
| Immigrants | Southern Europe | 68.7 /100 | #161 | Good 31.1% |
| Slovenes | 65.9 /100 | #162 | Good 31.2% |
| Immigrants | Chile | 65.7 /100 | #163 | Good 31.2% |
| Hungarians | 64.1 /100 | #164 | Good 31.2% |
| Immigrants | Somalia | 58.1 /100 | #165 | Average 31.4% |
| Peruvians | 55.5 /100 | #166 | Average 31.5% |
| Dutch | 55.3 /100 | #167 | Average 31.5% |
| Belgians | 52.4 /100 | #168 | Average 31.6% |
| Slavs | 52.0 /100 | #169 | Average 31.6% |
| Guamanians/Chamorros | 51.3 /100 | #170 | Average 31.6% |
| Finns | 50.5 /100 | #171 | Average 31.7% |
| Immigrants | Eritrea | 50.4 /100 | #172 | Average 31.7% |
| Immigrants | Yemen | 50.2 /100 | #173 | Average 31.7% |
| Venezuelans | 50.0 /100 | #174 | Average 31.7% |
| Immigrants | Venezuela | 49.2 /100 | #175 | Average 31.7% |
Demographics Similar to Immigrants from Cuba by Births to Unmarried Women
In terms of births to unmarried women, the demographic groups most similar to Immigrants from Cuba are Cheyenne (41.3%, a difference of 0.27%), Cape Verdean (41.3%, a difference of 0.33%), Sioux (41.0%, a difference of 1.1%), Cajun (41.0%, a difference of 1.2%), and Tsimshian (42.2%, a difference of 1.7%).
| Demographics | Rating | Rank | Births to Unmarried Women |
| Yakama | 0.0 /100 | #319 | Tragic 40.3% |
| Crow | 0.0 /100 | #320 | Tragic 40.4% |
| Bahamians | 0.0 /100 | #321 | Tragic 40.8% |
| Cajuns | 0.0 /100 | #322 | Tragic 41.0% |
| Sioux | 0.0 /100 | #323 | Tragic 41.0% |
| Cape Verdeans | 0.0 /100 | #324 | Tragic 41.3% |
| Cheyenne | 0.0 /100 | #325 | Tragic 41.3% |
| Immigrants | Cuba | 0.0 /100 | #326 | Tragic 41.5% |
| Tsimshian | 0.0 /100 | #327 | Tragic 42.2% |
| Immigrants | Cabo Verde | 0.0 /100 | #328 | Tragic 42.2% |
| Paiute | 0.0 /100 | #329 | Tragic 42.5% |
| Chippewa | 0.0 /100 | #330 | Tragic 42.6% |
| Natives/Alaskans | 0.0 /100 | #331 | Tragic 43.0% |
| Kiowa | 0.0 /100 | #332 | Tragic 43.1% |
| Blacks/African Americans | 0.0 /100 | #333 | Tragic 44.3% |