Cheyenne vs Immigrants from Barbados Births to Unmarried Women
COMPARE
Cheyenne
Immigrants from Barbados
Births to Unmarried Women
Births to Unmarried Women Comparison
Cheyenne
Immigrants from Barbados
41.3%
BIRTHS TO UNMARRIED WOMEN
0.0/ 100
METRIC RATING
325th/ 347
METRIC RANK
36.8%
BIRTHS TO UNMARRIED WOMEN
0.1/ 100
METRIC RATING
271st/ 347
METRIC RANK
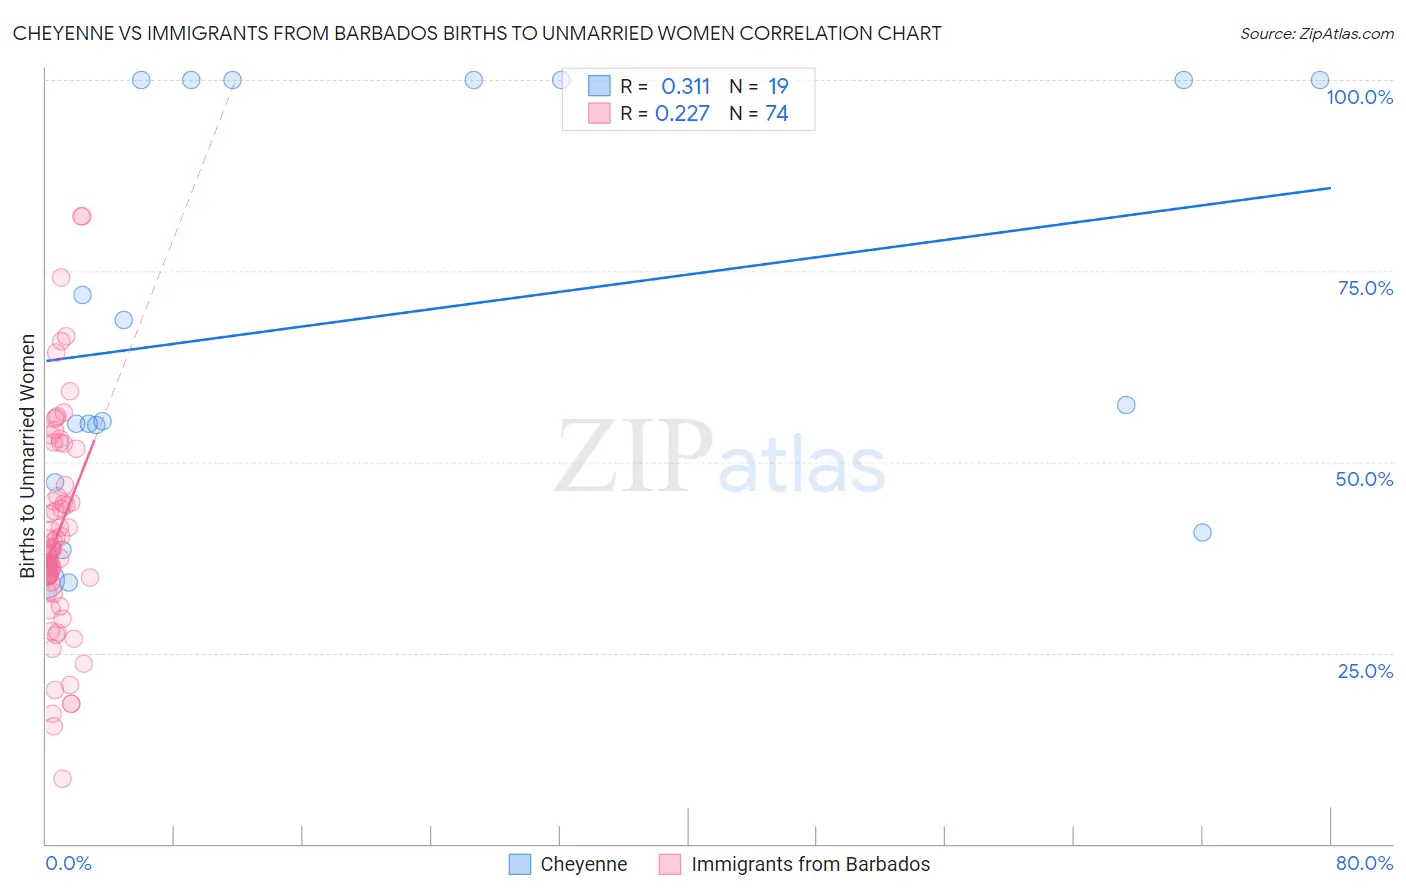
Cheyenne vs Immigrants from Barbados Births to Unmarried Women Correlation Chart
The statistical analysis conducted on geographies consisting of 79,528,425 people shows a mild positive correlation between the proportion of Cheyenne and percentage of births to unmarried women in the United States with a correlation coefficient (R) of 0.311 and weighted average of 41.3%. Similarly, the statistical analysis conducted on geographies consisting of 110,431,474 people shows a weak positive correlation between the proportion of Immigrants from Barbados and percentage of births to unmarried women in the United States with a correlation coefficient (R) of 0.227 and weighted average of 36.8%, a difference of 12.4%.
Births to Unmarried Women Correlation Summary
| Measurement | Cheyenne | Immigrants from Barbados |
| Minimum | 34.1% | 8.5% |
| Maximum | 100.0% | 82.2% |
| Range | 65.9% | 73.7% |
| Mean | 69.1% | 40.7% |
| Median | 57.4% | 38.4% |
| Interquartile 25% (IQ1) | 47.3% | 34.3% |
| Interquartile 75% (IQ3) | 100.0% | 47.0% |
| Interquartile Range (IQR) | 52.7% | 12.7% |
| Standard Deviation (Sample) | 26.1% | 14.4% |
| Standard Deviation (Population) | 25.4% | 14.3% |
Similar Demographics by Births to Unmarried Women
Demographics Similar to Cheyenne by Births to Unmarried Women
In terms of births to unmarried women, the demographic groups most similar to Cheyenne are Cape Verdean (41.3%, a difference of 0.060%), Immigrants from Cuba (41.5%, a difference of 0.27%), Sioux (41.0%, a difference of 0.85%), Cajun (41.0%, a difference of 0.93%), and Bahamian (40.8%, a difference of 1.4%).
| Demographics | Rating | Rank | Births to Unmarried Women |
| Immigrants | Bahamas | 0.0 /100 | #318 | Tragic 40.1% |
| Yakama | 0.0 /100 | #319 | Tragic 40.3% |
| Crow | 0.0 /100 | #320 | Tragic 40.4% |
| Bahamians | 0.0 /100 | #321 | Tragic 40.8% |
| Cajuns | 0.0 /100 | #322 | Tragic 41.0% |
| Sioux | 0.0 /100 | #323 | Tragic 41.0% |
| Cape Verdeans | 0.0 /100 | #324 | Tragic 41.3% |
| Cheyenne | 0.0 /100 | #325 | Tragic 41.3% |
| Immigrants | Cuba | 0.0 /100 | #326 | Tragic 41.5% |
| Tsimshian | 0.0 /100 | #327 | Tragic 42.2% |
| Immigrants | Cabo Verde | 0.0 /100 | #328 | Tragic 42.2% |
| Paiute | 0.0 /100 | #329 | Tragic 42.5% |
| Chippewa | 0.0 /100 | #330 | Tragic 42.6% |
| Natives/Alaskans | 0.0 /100 | #331 | Tragic 43.0% |
| Kiowa | 0.0 /100 | #332 | Tragic 43.1% |
Demographics Similar to Immigrants from Barbados by Births to Unmarried Women
In terms of births to unmarried women, the demographic groups most similar to Immigrants from Barbados are Immigrants from Congo (36.8%, a difference of 0.030%), Senegalese (36.8%, a difference of 0.10%), Comanche (36.7%, a difference of 0.22%), Choctaw (36.9%, a difference of 0.22%), and Central American (36.7%, a difference of 0.23%).
| Demographics | Rating | Rank | Births to Unmarried Women |
| Sub-Saharan Africans | 0.1 /100 | #264 | Tragic 36.7% |
| Cherokee | 0.1 /100 | #265 | Tragic 36.7% |
| Immigrants | Senegal | 0.1 /100 | #266 | Tragic 36.7% |
| Central Americans | 0.1 /100 | #267 | Tragic 36.7% |
| Comanche | 0.1 /100 | #268 | Tragic 36.7% |
| Senegalese | 0.1 /100 | #269 | Tragic 36.8% |
| Immigrants | Congo | 0.1 /100 | #270 | Tragic 36.8% |
| Immigrants | Barbados | 0.1 /100 | #271 | Tragic 36.8% |
| Choctaw | 0.1 /100 | #272 | Tragic 36.9% |
| Mexicans | 0.1 /100 | #273 | Tragic 36.9% |
| Cree | 0.1 /100 | #274 | Tragic 37.0% |
| Barbadians | 0.1 /100 | #275 | Tragic 37.0% |
| Belizeans | 0.1 /100 | #276 | Tragic 37.0% |
| Guatemalans | 0.1 /100 | #277 | Tragic 37.1% |
| Immigrants | Latin America | 0.1 /100 | #278 | Tragic 37.1% |