Inupiat vs Scotch-Irish Family Households with Children
COMPARE
Inupiat
Scotch-Irish
Family Households with Children
Family Households with Children Comparison
Inupiat
Scotch-Irish
32.8%
FAMILY HOUSEHOLDS WITH CHILDREN
100/ 100
METRIC RATING
2nd/ 347
METRIC RANK
26.8%
FAMILY HOUSEHOLDS WITH CHILDREN
1.4/ 100
METRIC RATING
256th/ 347
METRIC RANK
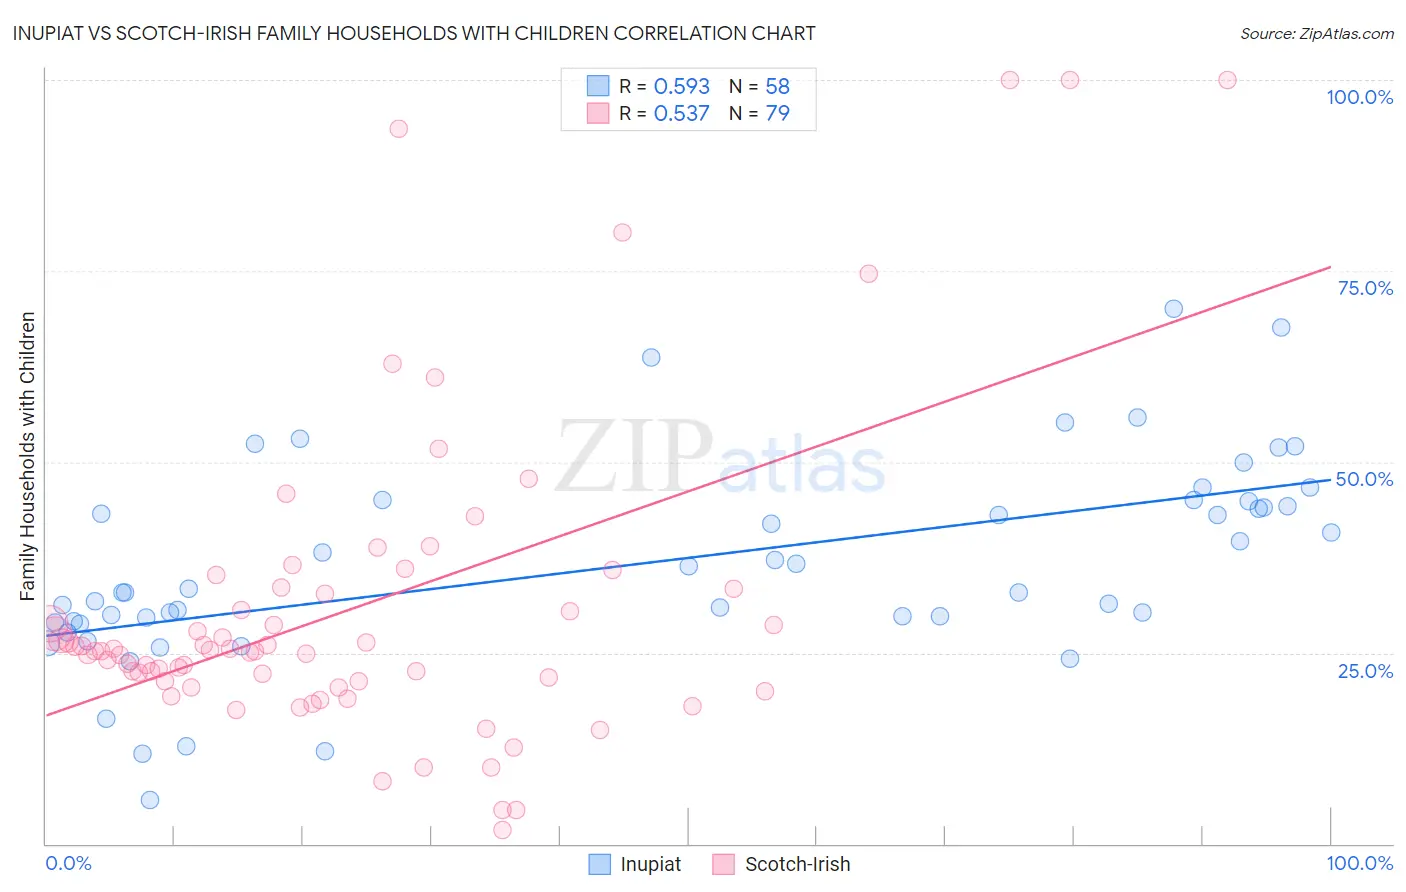
Inupiat vs Scotch-Irish Family Households with Children Correlation Chart
The statistical analysis conducted on geographies consisting of 96,318,609 people shows a substantial positive correlation between the proportion of Inupiat and percentage of family households with children in the United States with a correlation coefficient (R) of 0.593 and weighted average of 32.8%. Similarly, the statistical analysis conducted on geographies consisting of 548,065,437 people shows a substantial positive correlation between the proportion of Scotch-Irish and percentage of family households with children in the United States with a correlation coefficient (R) of 0.537 and weighted average of 26.8%, a difference of 22.5%.
Family Households with Children Correlation Summary
| Measurement | Inupiat | Scotch-Irish |
| Minimum | 5.8% | 1.9% |
| Maximum | 70.0% | 100.0% |
| Range | 64.2% | 98.1% |
| Mean | 36.6% | 30.8% |
| Median | 33.1% | 25.3% |
| Interquartile 25% (IQ1) | 29.1% | 21.2% |
| Interquartile 75% (IQ3) | 44.8% | 33.3% |
| Interquartile Range (IQR) | 15.7% | 12.1% |
| Standard Deviation (Sample) | 13.3% | 20.6% |
| Standard Deviation (Population) | 13.2% | 20.5% |
Similar Demographics by Family Households with Children
Demographics Similar to Inupiat by Family Households with Children
In terms of family households with children, the demographic groups most similar to Inupiat are Immigrants from Mexico (31.6%, a difference of 3.9%), Mexican (31.4%, a difference of 4.7%), Tongan (31.2%, a difference of 5.1%), Immigrants from India (31.0%, a difference of 5.8%), and Immigrants from Central America (31.0%, a difference of 6.1%).
| Demographics | Rating | Rank | Family Households with Children |
| Yup'ik | 100 /100 | #1 | Exceptional 37.0% |
| Inupiat | 100 /100 | #2 | Exceptional 32.8% |
| Immigrants | Mexico | 100.0 /100 | #3 | Exceptional 31.6% |
| Mexicans | 100.0 /100 | #4 | Exceptional 31.4% |
| Tongans | 100.0 /100 | #5 | Exceptional 31.2% |
| Immigrants | India | 100.0 /100 | #6 | Exceptional 31.0% |
| Immigrants | Central America | 100.0 /100 | #7 | Exceptional 31.0% |
| Yakama | 100.0 /100 | #8 | Exceptional 30.8% |
| Thais | 100.0 /100 | #9 | Exceptional 30.6% |
| Immigrants | Fiji | 100.0 /100 | #10 | Exceptional 30.5% |
| Nepalese | 100.0 /100 | #11 | Exceptional 30.5% |
| Immigrants | Pakistan | 100.0 /100 | #12 | Exceptional 30.2% |
| Afghans | 100.0 /100 | #13 | Exceptional 30.2% |
| Bangladeshis | 100.0 /100 | #14 | Exceptional 30.1% |
| Immigrants | South Central Asia | 100.0 /100 | #15 | Exceptional 30.0% |
Demographics Similar to Scotch-Irish by Family Households with Children
In terms of family households with children, the demographic groups most similar to Scotch-Irish are German Russian (26.8%, a difference of 0.010%), Immigrants from Scotland (26.8%, a difference of 0.020%), Italian (26.8%, a difference of 0.050%), Slavic (26.8%, a difference of 0.050%), and Immigrants from Cuba (26.8%, a difference of 0.050%).
| Demographics | Rating | Rank | Family Households with Children |
| Immigrants | Eastern Europe | 2.1 /100 | #249 | Tragic 26.9% |
| Belgians | 2.1 /100 | #250 | Tragic 26.9% |
| Immigrants | Bosnia and Herzegovina | 1.9 /100 | #251 | Tragic 26.8% |
| Irish | 1.8 /100 | #252 | Tragic 26.8% |
| Italians | 1.5 /100 | #253 | Tragic 26.8% |
| Immigrants | Scotland | 1.5 /100 | #254 | Tragic 26.8% |
| German Russians | 1.5 /100 | #255 | Tragic 26.8% |
| Scotch-Irish | 1.4 /100 | #256 | Tragic 26.8% |
| Slavs | 1.3 /100 | #257 | Tragic 26.8% |
| Immigrants | Cuba | 1.3 /100 | #258 | Tragic 26.8% |
| Immigrants | Lithuania | 1.2 /100 | #259 | Tragic 26.8% |
| Immigrants | Jamaica | 1.2 /100 | #260 | Tragic 26.8% |
| Immigrants | Belarus | 1.1 /100 | #261 | Tragic 26.8% |
| Immigrants | Russia | 1.0 /100 | #262 | Tragic 26.8% |
| Immigrants | North Macedonia | 1.0 /100 | #263 | Tragic 26.7% |