Australian vs Scotch-Irish Family Households with Children
COMPARE
Australian
Scotch-Irish
Family Households with Children
Family Households with Children Comparison
Australians
Scotch-Irish
26.9%
FAMILY HOUSEHOLDS WITH CHILDREN
2.8/ 100
METRIC RATING
245th/ 347
METRIC RANK
26.8%
FAMILY HOUSEHOLDS WITH CHILDREN
1.4/ 100
METRIC RATING
256th/ 347
METRIC RANK
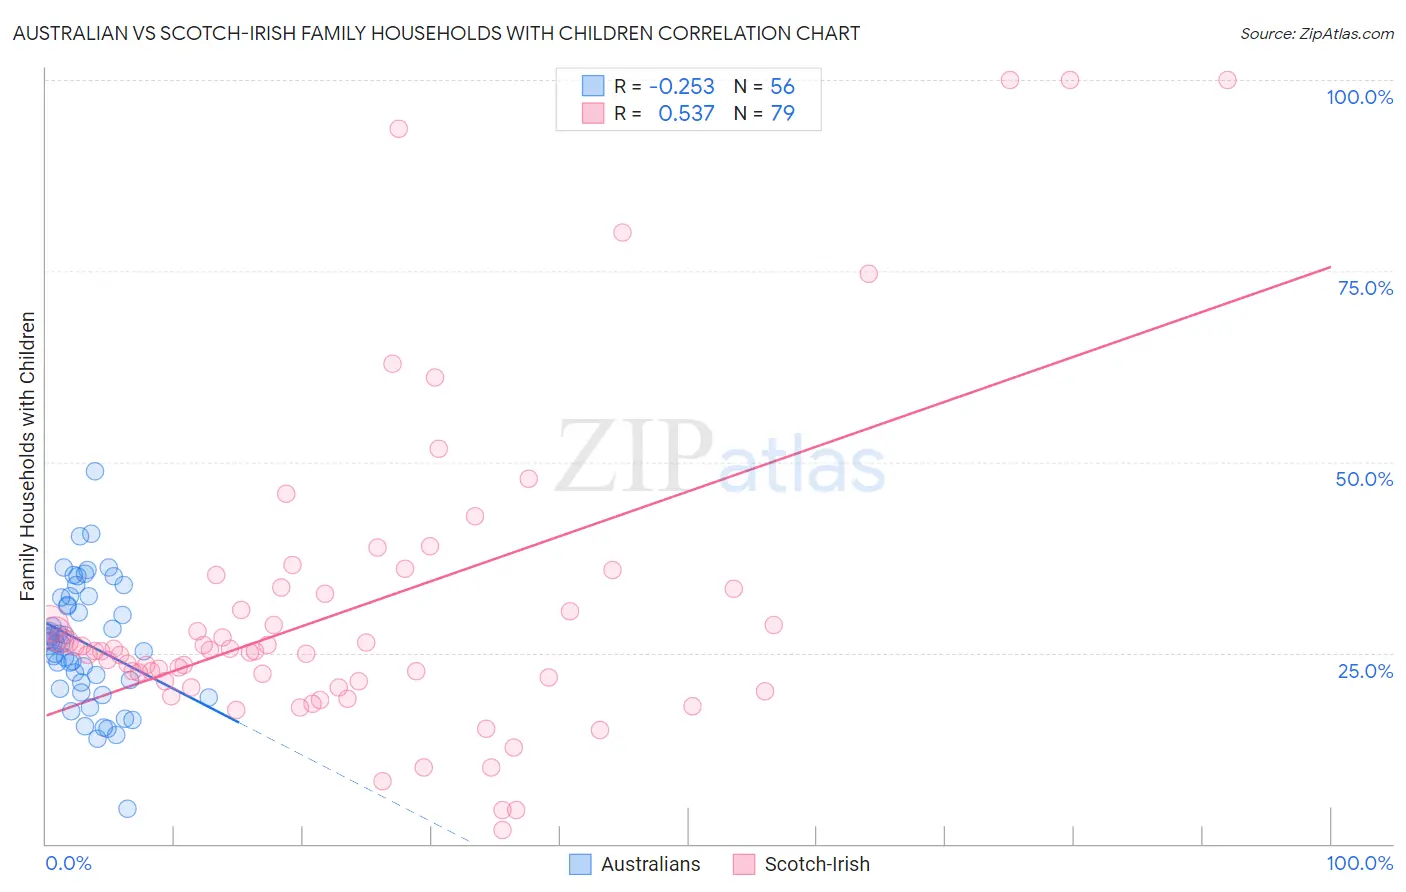
Australian vs Scotch-Irish Family Households with Children Correlation Chart
The statistical analysis conducted on geographies consisting of 223,944,645 people shows a weak negative correlation between the proportion of Australians and percentage of family households with children in the United States with a correlation coefficient (R) of -0.253 and weighted average of 26.9%. Similarly, the statistical analysis conducted on geographies consisting of 548,065,437 people shows a substantial positive correlation between the proportion of Scotch-Irish and percentage of family households with children in the United States with a correlation coefficient (R) of 0.537 and weighted average of 26.8%, a difference of 0.38%.
Family Households with Children Correlation Summary
| Measurement | Australian | Scotch-Irish |
| Minimum | 4.6% | 1.9% |
| Maximum | 48.8% | 100.0% |
| Range | 44.2% | 98.1% |
| Mean | 26.3% | 30.8% |
| Median | 26.4% | 25.3% |
| Interquartile 25% (IQ1) | 20.8% | 21.2% |
| Interquartile 75% (IQ3) | 32.4% | 33.3% |
| Interquartile Range (IQR) | 11.6% | 12.1% |
| Standard Deviation (Sample) | 8.1% | 20.6% |
| Standard Deviation (Population) | 8.0% | 20.5% |
Demographics Similar to Australians and Scotch-Irish by Family Households with Children
In terms of family households with children, the demographic groups most similar to Australians are Ukrainian (26.9%, a difference of 0.020%), Immigrants from Saudi Arabia (26.9%, a difference of 0.030%), Jamaican (26.9%, a difference of 0.070%), Immigrants from Bulgaria (26.9%, a difference of 0.090%), and Navajo (26.9%, a difference of 0.090%). Similarly, the demographic groups most similar to Scotch-Irish are German Russian (26.8%, a difference of 0.010%), Immigrants from Scotland (26.8%, a difference of 0.020%), Italian (26.8%, a difference of 0.050%), Slavic (26.8%, a difference of 0.050%), and Immigrants from Cuba (26.8%, a difference of 0.050%).
| Demographics | Rating | Rank | Family Households with Children |
| Immigrants | Bulgaria | 3.3 /100 | #240 | Tragic 26.9% |
| Navajo | 3.2 /100 | #241 | Tragic 26.9% |
| Immigrants | England | 3.2 /100 | #242 | Tragic 26.9% |
| Immigrants | Saudi Arabia | 2.9 /100 | #243 | Tragic 26.9% |
| Ukrainians | 2.9 /100 | #244 | Tragic 26.9% |
| Australians | 2.8 /100 | #245 | Tragic 26.9% |
| Jamaicans | 2.5 /100 | #246 | Tragic 26.9% |
| Potawatomi | 2.2 /100 | #247 | Tragic 26.9% |
| Immigrants | Kazakhstan | 2.2 /100 | #248 | Tragic 26.9% |
| Immigrants | Eastern Europe | 2.1 /100 | #249 | Tragic 26.9% |
| Belgians | 2.1 /100 | #250 | Tragic 26.9% |
| Immigrants | Bosnia and Herzegovina | 1.9 /100 | #251 | Tragic 26.8% |
| Irish | 1.8 /100 | #252 | Tragic 26.8% |
| Italians | 1.5 /100 | #253 | Tragic 26.8% |
| Immigrants | Scotland | 1.5 /100 | #254 | Tragic 26.8% |
| German Russians | 1.5 /100 | #255 | Tragic 26.8% |
| Scotch-Irish | 1.4 /100 | #256 | Tragic 26.8% |
| Slavs | 1.3 /100 | #257 | Tragic 26.8% |
| Immigrants | Cuba | 1.3 /100 | #258 | Tragic 26.8% |
| Immigrants | Lithuania | 1.2 /100 | #259 | Tragic 26.8% |
| Immigrants | Jamaica | 1.2 /100 | #260 | Tragic 26.8% |