Lebanese vs Immigrants from Norway Divorced or Separated
COMPARE
Lebanese
Immigrants from Norway
Divorced or Separated
Divorced or Separated Comparison
Lebanese
Immigrants from Norway
11.9%
DIVORCED OR SEPARATED
83.4/ 100
METRIC RATING
140th/ 347
METRIC RANK
11.7%
DIVORCED OR SEPARATED
95.9/ 100
METRIC RATING
114th/ 347
METRIC RANK
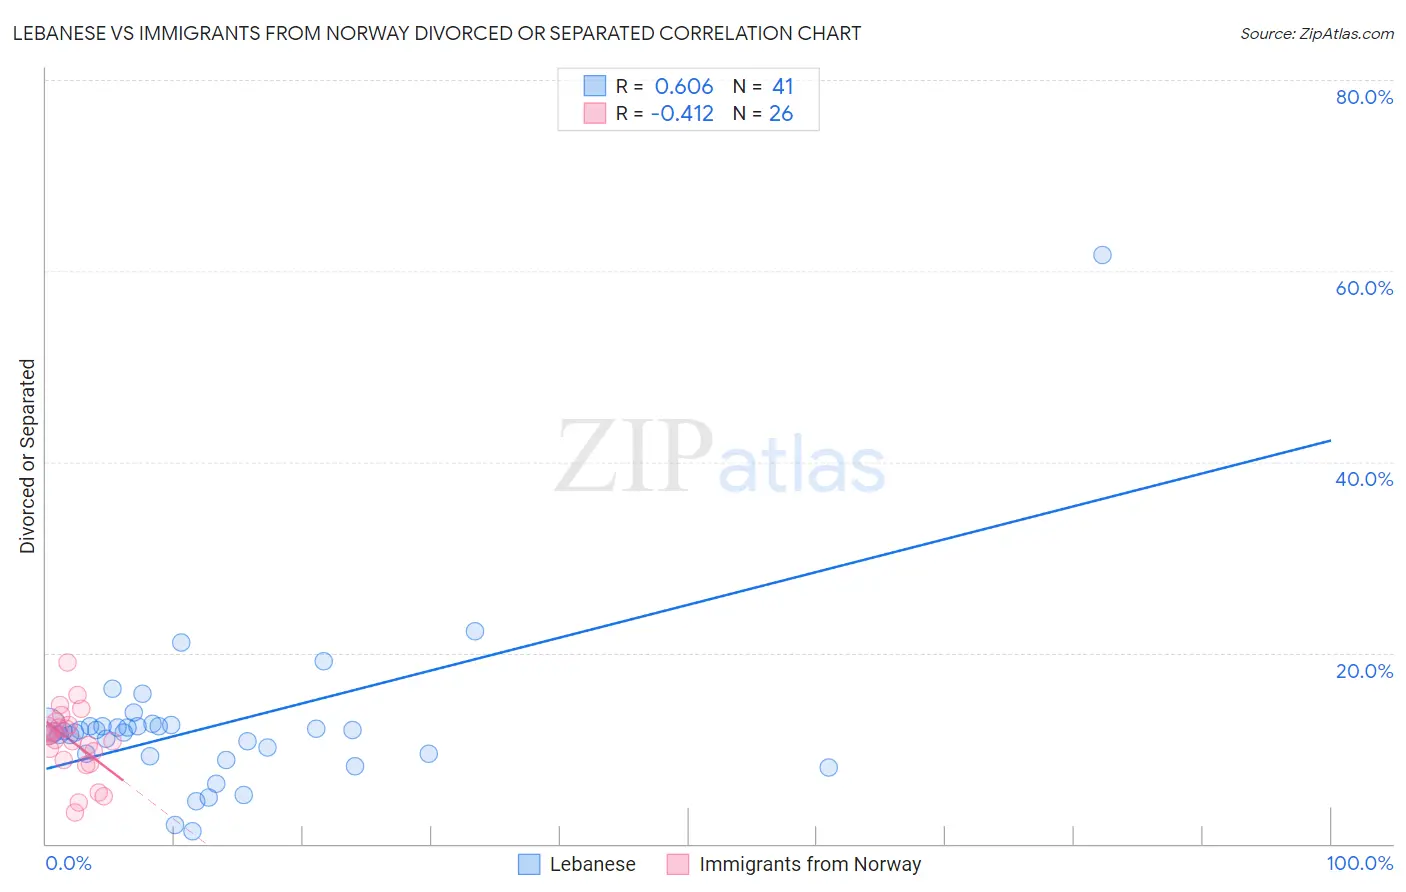
Lebanese vs Immigrants from Norway Divorced or Separated Correlation Chart
The statistical analysis conducted on geographies consisting of 401,417,076 people shows a significant positive correlation between the proportion of Lebanese and percentage of population currently divorced or separated in the United States with a correlation coefficient (R) of 0.606 and weighted average of 11.9%. Similarly, the statistical analysis conducted on geographies consisting of 116,710,003 people shows a moderate negative correlation between the proportion of Immigrants from Norway and percentage of population currently divorced or separated in the United States with a correlation coefficient (R) of -0.412 and weighted average of 11.7%, a difference of 1.4%.
Divorced or Separated Correlation Summary
| Measurement | Lebanese | Immigrants from Norway |
| Minimum | 1.3% | 3.3% |
| Maximum | 61.7% | 18.9% |
| Range | 60.4% | 15.6% |
| Mean | 12.4% | 10.7% |
| Median | 11.8% | 11.0% |
| Interquartile 25% (IQ1) | 9.2% | 8.8% |
| Interquartile 75% (IQ3) | 12.3% | 12.5% |
| Interquartile Range (IQR) | 3.1% | 3.6% |
| Standard Deviation (Sample) | 9.0% | 3.6% |
| Standard Deviation (Population) | 8.9% | 3.5% |
Similar Demographics by Divorced or Separated
Demographics Similar to Lebanese by Divorced or Separated
In terms of divorced or separated, the demographic groups most similar to Lebanese are Australian (11.9%, a difference of 0.020%), Immigrants from Netherlands (11.9%, a difference of 0.030%), Immigrants from Morocco (11.9%, a difference of 0.030%), Alsatian (11.9%, a difference of 0.040%), and Carpatho Rusyn (11.9%, a difference of 0.090%).
| Demographics | Rating | Rank | Divorced or Separated |
| New Zealanders | 87.5 /100 | #133 | Excellent 11.9% |
| Argentineans | 85.1 /100 | #134 | Excellent 11.9% |
| Danes | 84.8 /100 | #135 | Excellent 11.9% |
| Carpatho Rusyns | 84.8 /100 | #136 | Excellent 11.9% |
| Alsatians | 84.0 /100 | #137 | Excellent 11.9% |
| Immigrants | Netherlands | 83.9 /100 | #138 | Excellent 11.9% |
| Australians | 83.6 /100 | #139 | Excellent 11.9% |
| Lebanese | 83.4 /100 | #140 | Excellent 11.9% |
| Immigrants | Morocco | 82.9 /100 | #141 | Excellent 11.9% |
| Immigrants | Zimbabwe | 81.5 /100 | #142 | Excellent 11.9% |
| Pakistanis | 81.3 /100 | #143 | Excellent 11.9% |
| Peruvians | 80.9 /100 | #144 | Excellent 11.9% |
| Croatians | 80.6 /100 | #145 | Excellent 11.9% |
| Immigrants | Grenada | 79.1 /100 | #146 | Good 11.9% |
| Poles | 78.6 /100 | #147 | Good 11.9% |
Demographics Similar to Immigrants from Norway by Divorced or Separated
In terms of divorced or separated, the demographic groups most similar to Immigrants from Norway are Lithuanian (11.7%, a difference of 0.050%), Immigrants from Iraq (11.7%, a difference of 0.12%), Immigrants from Uganda (11.7%, a difference of 0.13%), Ecuadorian (11.7%, a difference of 0.14%), and Immigrants from France (11.7%, a difference of 0.17%).
| Demographics | Rating | Rank | Divorced or Separated |
| Native Hawaiians | 97.2 /100 | #107 | Exceptional 11.7% |
| Greeks | 96.9 /100 | #108 | Exceptional 11.7% |
| Immigrants | South Africa | 96.9 /100 | #109 | Exceptional 11.7% |
| Immigrants | Czechoslovakia | 96.9 /100 | #110 | Exceptional 11.7% |
| Immigrants | Spain | 96.8 /100 | #111 | Exceptional 11.7% |
| Immigrants | France | 96.6 /100 | #112 | Exceptional 11.7% |
| Estonians | 96.6 /100 | #113 | Exceptional 11.7% |
| Immigrants | Norway | 95.9 /100 | #114 | Exceptional 11.7% |
| Lithuanians | 95.7 /100 | #115 | Exceptional 11.7% |
| Immigrants | Iraq | 95.4 /100 | #116 | Exceptional 11.7% |
| Immigrants | Uganda | 95.3 /100 | #117 | Exceptional 11.7% |
| Ecuadorians | 95.3 /100 | #118 | Exceptional 11.7% |
| Syrians | 95.1 /100 | #119 | Exceptional 11.7% |
| Iraqis | 94.6 /100 | #120 | Exceptional 11.8% |
| Romanians | 94.5 /100 | #121 | Exceptional 11.8% |