Immigrants from Venezuela vs Swedish Average Family Size
COMPARE
Immigrants from Venezuela
Swedish
Average Family Size
Average Family Size Comparison
Immigrants from Venezuela
Swedes
3.26
AVERAGE FAMILY SIZE
86.3/ 100
METRIC RATING
133rd/ 347
METRIC RANK
3.10
AVERAGE FAMILY SIZE
0.0/ 100
METRIC RATING
337th/ 347
METRIC RANK
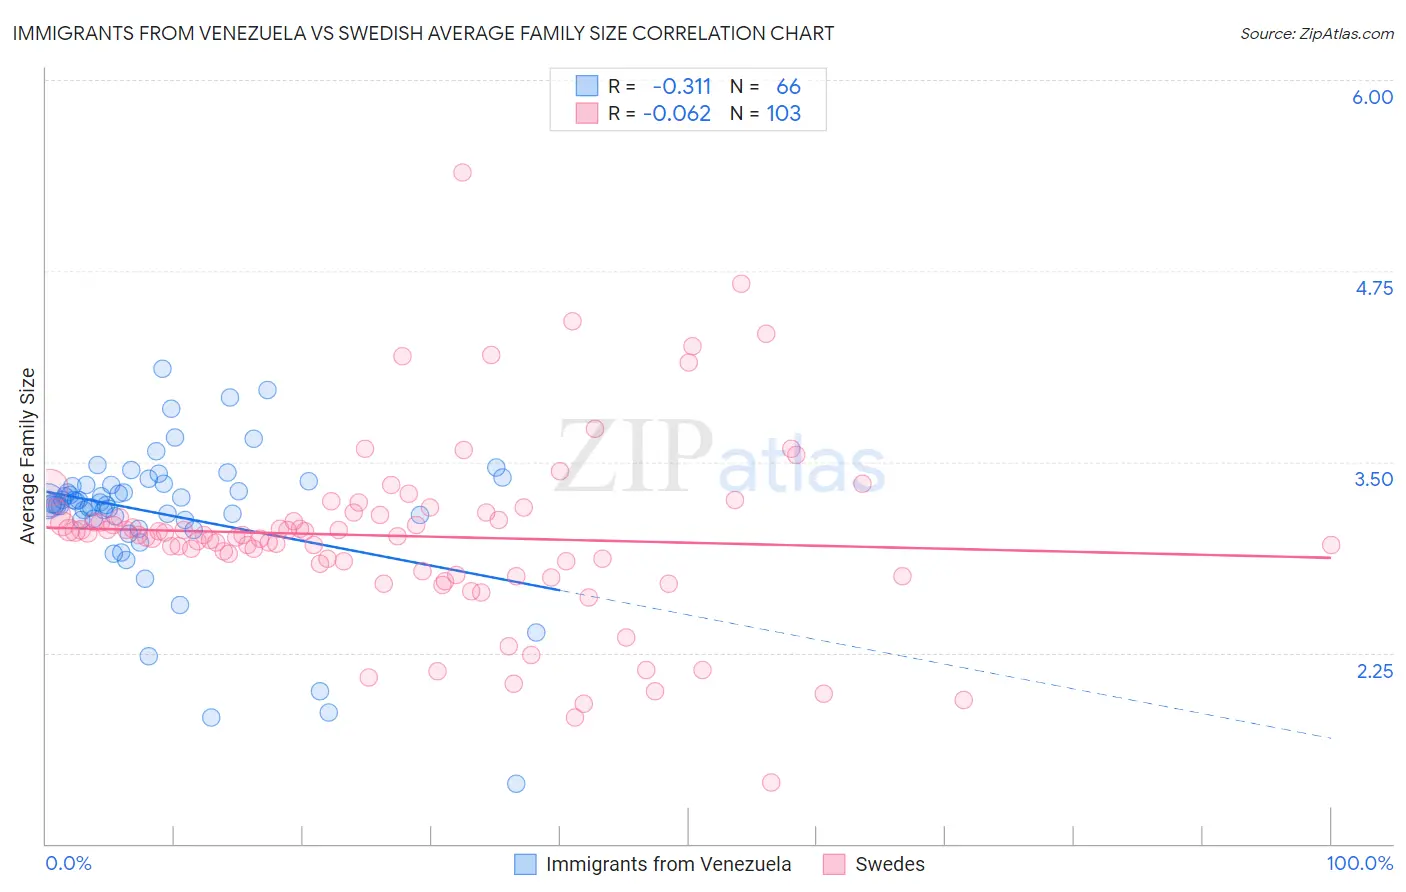
Immigrants from Venezuela vs Swedish Average Family Size Correlation Chart
The statistical analysis conducted on geographies consisting of 287,786,704 people shows a mild negative correlation between the proportion of Immigrants from Venezuela and average family size in the United States with a correlation coefficient (R) of -0.311 and weighted average of 3.26. Similarly, the statistical analysis conducted on geographies consisting of 538,762,324 people shows a slight negative correlation between the proportion of Swedes and average family size in the United States with a correlation coefficient (R) of -0.062 and weighted average of 3.10, a difference of 5.0%.
Average Family Size Correlation Summary
| Measurement | Immigrants from Venezuela | Swedish |
| Minimum | 1.39 | 1.40 |
| Maximum | 4.11 | 5.39 |
| Range | 2.72 | 3.99 |
| Mean | 3.16 | 3.01 |
| Median | 3.23 | 3.02 |
| Interquartile 25% (IQ1) | 3.12 | 2.79 |
| Interquartile 75% (IQ3) | 3.35 | 3.16 |
| Interquartile Range (IQR) | 0.23 | 0.37 |
| Standard Deviation (Sample) | 0.47 | 0.59 |
| Standard Deviation (Population) | 0.47 | 0.59 |
Similar Demographics by Average Family Size
Demographics Similar to Immigrants from Venezuela by Average Family Size
In terms of average family size, the demographic groups most similar to Immigrants from Venezuela are Costa Rican (3.26, a difference of 0.020%), African (3.25, a difference of 0.050%), Immigrants from Western Asia (3.26, a difference of 0.060%), Panamanian (3.25, a difference of 0.070%), and Laotian (3.26, a difference of 0.090%).
| Demographics | Rating | Rank | Average Family Size |
| Immigrants | Costa Rica | 90.7 /100 | #126 | Exceptional 3.26 |
| Immigrants | Syria | 90.6 /100 | #127 | Exceptional 3.26 |
| Colombians | 89.9 /100 | #128 | Excellent 3.26 |
| Immigrants | Hong Kong | 88.6 /100 | #129 | Excellent 3.26 |
| Laotians | 88.5 /100 | #130 | Excellent 3.26 |
| Immigrants | Western Asia | 87.7 /100 | #131 | Excellent 3.26 |
| Costa Ricans | 86.8 /100 | #132 | Excellent 3.26 |
| Immigrants | Venezuela | 86.3 /100 | #133 | Excellent 3.26 |
| Africans | 84.9 /100 | #134 | Excellent 3.25 |
| Panamanians | 84.2 /100 | #135 | Excellent 3.25 |
| Comanche | 82.8 /100 | #136 | Excellent 3.25 |
| Immigrants | Middle Africa | 82.4 /100 | #137 | Excellent 3.25 |
| Cubans | 81.8 /100 | #138 | Excellent 3.25 |
| Immigrants | Ethiopia | 81.6 /100 | #139 | Excellent 3.25 |
| Sub-Saharan Africans | 81.6 /100 | #140 | Excellent 3.25 |
Demographics Similar to Swedes by Average Family Size
In terms of average family size, the demographic groups most similar to Swedes are French (3.10, a difference of 0.020%), Irish (3.10, a difference of 0.030%), Croatian (3.10, a difference of 0.030%), Luxembourger (3.10, a difference of 0.090%), and Lithuanian (3.10, a difference of 0.12%).
| Demographics | Rating | Rank | Average Family Size |
| Latvians | 0.0 /100 | #330 | Tragic 3.11 |
| Scotch-Irish | 0.0 /100 | #331 | Tragic 3.11 |
| Scottish | 0.0 /100 | #332 | Tragic 3.11 |
| Estonians | 0.0 /100 | #333 | Tragic 3.10 |
| Lithuanians | 0.0 /100 | #334 | Tragic 3.10 |
| Luxembourgers | 0.0 /100 | #335 | Tragic 3.10 |
| Irish | 0.0 /100 | #336 | Tragic 3.10 |
| Swedes | 0.0 /100 | #337 | Tragic 3.10 |
| French | 0.0 /100 | #338 | Tragic 3.10 |
| Croatians | 0.0 /100 | #339 | Tragic 3.10 |
| Finns | 0.0 /100 | #340 | Tragic 3.09 |
| Poles | 0.0 /100 | #341 | Tragic 3.09 |
| Germans | 0.0 /100 | #342 | Tragic 3.09 |
| Norwegians | 0.0 /100 | #343 | Tragic 3.08 |
| French Canadians | 0.0 /100 | #344 | Tragic 3.07 |