Immigrants from Congo vs Swedish Average Family Size
COMPARE
Immigrants from Congo
Swedish
Average Family Size
Average Family Size Comparison
Immigrants from Congo
Swedes
3.23
AVERAGE FAMILY SIZE
52.7/ 100
METRIC RATING
172nd/ 347
METRIC RANK
3.10
AVERAGE FAMILY SIZE
0.0/ 100
METRIC RATING
337th/ 347
METRIC RANK
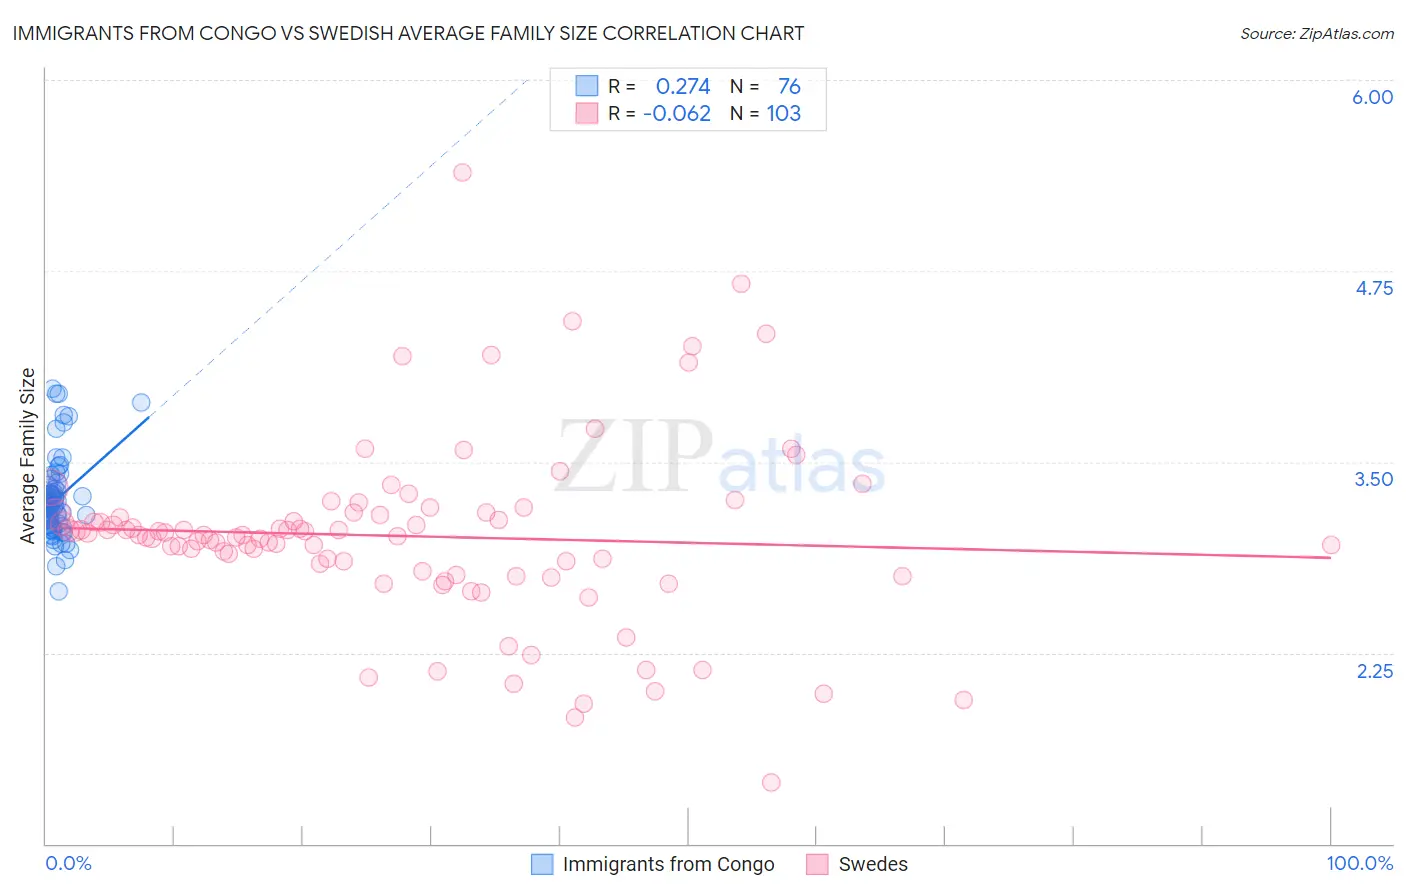
Immigrants from Congo vs Swedish Average Family Size Correlation Chart
The statistical analysis conducted on geographies consisting of 92,087,751 people shows a weak positive correlation between the proportion of Immigrants from Congo and average family size in the United States with a correlation coefficient (R) of 0.274 and weighted average of 3.23. Similarly, the statistical analysis conducted on geographies consisting of 538,762,324 people shows a slight negative correlation between the proportion of Swedes and average family size in the United States with a correlation coefficient (R) of -0.062 and weighted average of 3.10, a difference of 4.2%.
Average Family Size Correlation Summary
| Measurement | Immigrants from Congo | Swedish |
| Minimum | 2.65 | 1.40 |
| Maximum | 3.97 | 5.39 |
| Range | 1.32 | 3.99 |
| Mean | 3.25 | 3.01 |
| Median | 3.21 | 3.02 |
| Interquartile 25% (IQ1) | 3.09 | 2.79 |
| Interquartile 75% (IQ3) | 3.32 | 3.16 |
| Interquartile Range (IQR) | 0.23 | 0.37 |
| Standard Deviation (Sample) | 0.26 | 0.59 |
| Standard Deviation (Population) | 0.26 | 0.59 |
Similar Demographics by Average Family Size
Demographics Similar to Immigrants from Congo by Average Family Size
In terms of average family size, the demographic groups most similar to Immigrants from Congo are Chilean (3.23, a difference of 0.010%), Immigrants from Uruguay (3.23, a difference of 0.010%), Arab (3.23, a difference of 0.020%), Taiwanese (3.23, a difference of 0.030%), and Aleut (3.23, a difference of 0.030%).
| Demographics | Rating | Rank | Average Family Size |
| Ugandans | 58.4 /100 | #165 | Average 3.23 |
| Immigrants | Senegal | 57.5 /100 | #166 | Average 3.23 |
| Dutch West Indians | 56.9 /100 | #167 | Average 3.23 |
| Taiwanese | 54.2 /100 | #168 | Average 3.23 |
| Aleuts | 54.1 /100 | #169 | Average 3.23 |
| Arabs | 53.8 /100 | #170 | Average 3.23 |
| Chileans | 53.2 /100 | #171 | Average 3.23 |
| Immigrants | Congo | 52.7 /100 | #172 | Average 3.23 |
| Immigrants | Uruguay | 52.0 /100 | #173 | Average 3.23 |
| Immigrants | South Central Asia | 50.0 /100 | #174 | Average 3.23 |
| Immigrants | China | 49.9 /100 | #175 | Average 3.23 |
| Israelis | 48.7 /100 | #176 | Average 3.23 |
| Argentineans | 47.4 /100 | #177 | Average 3.23 |
| Spaniards | 47.2 /100 | #178 | Average 3.23 |
| Immigrants | Korea | 46.9 /100 | #179 | Average 3.23 |
Demographics Similar to Swedes by Average Family Size
In terms of average family size, the demographic groups most similar to Swedes are French (3.10, a difference of 0.020%), Irish (3.10, a difference of 0.030%), Croatian (3.10, a difference of 0.030%), Luxembourger (3.10, a difference of 0.090%), and Lithuanian (3.10, a difference of 0.12%).
| Demographics | Rating | Rank | Average Family Size |
| Latvians | 0.0 /100 | #330 | Tragic 3.11 |
| Scotch-Irish | 0.0 /100 | #331 | Tragic 3.11 |
| Scottish | 0.0 /100 | #332 | Tragic 3.11 |
| Estonians | 0.0 /100 | #333 | Tragic 3.10 |
| Lithuanians | 0.0 /100 | #334 | Tragic 3.10 |
| Luxembourgers | 0.0 /100 | #335 | Tragic 3.10 |
| Irish | 0.0 /100 | #336 | Tragic 3.10 |
| Swedes | 0.0 /100 | #337 | Tragic 3.10 |
| French | 0.0 /100 | #338 | Tragic 3.10 |
| Croatians | 0.0 /100 | #339 | Tragic 3.10 |
| Finns | 0.0 /100 | #340 | Tragic 3.09 |
| Poles | 0.0 /100 | #341 | Tragic 3.09 |
| Germans | 0.0 /100 | #342 | Tragic 3.09 |
| Norwegians | 0.0 /100 | #343 | Tragic 3.08 |
| French Canadians | 0.0 /100 | #344 | Tragic 3.07 |