English vs Immigrants from Sierra Leone Single Father Households
COMPARE
English
Immigrants from Sierra Leone
Single Father Households
Single Father Households Comparison
English
Immigrants from Sierra Leone
2.3%
SINGLE FATHER HOUSEHOLDS
68.6/ 100
METRIC RATING
166th/ 347
METRIC RANK
2.5%
SINGLE FATHER HOUSEHOLDS
5.8/ 100
METRIC RATING
238th/ 347
METRIC RANK
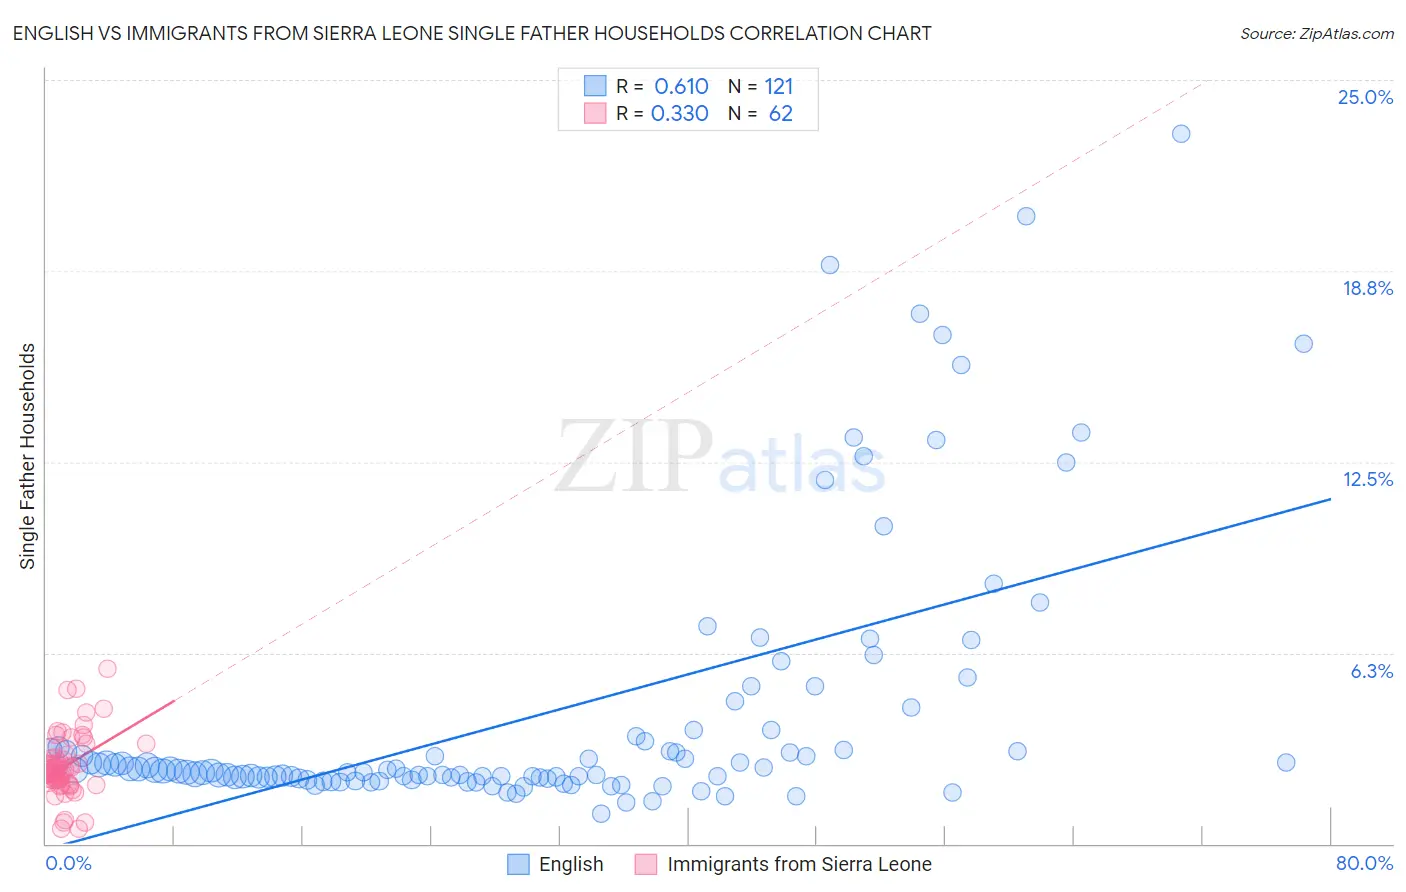
English vs Immigrants from Sierra Leone Single Father Households Correlation Chart
The statistical analysis conducted on geographies consisting of 561,704,434 people shows a significant positive correlation between the proportion of English and percentage of single father households in the United States with a correlation coefficient (R) of 0.610 and weighted average of 2.3%. Similarly, the statistical analysis conducted on geographies consisting of 101,470,770 people shows a mild positive correlation between the proportion of Immigrants from Sierra Leone and percentage of single father households in the United States with a correlation coefficient (R) of 0.330 and weighted average of 2.5%, a difference of 6.7%.
Single Father Households Correlation Summary
| Measurement | English | Immigrants from Sierra Leone |
| Minimum | 0.99% | 0.47% |
| Maximum | 23.3% | 5.7% |
| Range | 22.3% | 5.3% |
| Mean | 4.3% | 2.5% |
| Median | 2.4% | 2.4% |
| Interquartile 25% (IQ1) | 2.2% | 2.1% |
| Interquartile 75% (IQ3) | 3.4% | 2.9% |
| Interquartile Range (IQR) | 1.3% | 0.83% |
| Standard Deviation (Sample) | 4.4% | 1.0% |
| Standard Deviation (Population) | 4.4% | 1.0% |
Similar Demographics by Single Father Households
Demographics Similar to English by Single Father Households
In terms of single father households, the demographic groups most similar to English are Scotch-Irish (2.3%, a difference of 0.070%), Pakistani (2.3%, a difference of 0.17%), Irish (2.3%, a difference of 0.31%), South American (2.3%, a difference of 0.36%), and Scottish (2.3%, a difference of 0.38%).
| Demographics | Rating | Rank | Single Father Households |
| Immigrants | West Indies | 77.9 /100 | #159 | Good 2.3% |
| Immigrants | Bolivia | 76.3 /100 | #160 | Good 2.3% |
| Swiss | 73.2 /100 | #161 | Good 2.3% |
| Scottish | 72.8 /100 | #162 | Good 2.3% |
| Irish | 72.1 /100 | #163 | Good 2.3% |
| Pakistanis | 70.6 /100 | #164 | Good 2.3% |
| Scotch-Irish | 69.4 /100 | #165 | Good 2.3% |
| English | 68.6 /100 | #166 | Good 2.3% |
| South Americans | 64.3 /100 | #167 | Good 2.3% |
| Icelanders | 63.1 /100 | #168 | Good 2.3% |
| Czechs | 62.5 /100 | #169 | Good 2.3% |
| Ugandans | 62.2 /100 | #170 | Good 2.3% |
| Swedes | 61.6 /100 | #171 | Good 2.3% |
| Czechoslovakians | 58.9 /100 | #172 | Average 2.3% |
| Celtics | 55.4 /100 | #173 | Average 2.3% |
Demographics Similar to Immigrants from Sierra Leone by Single Father Households
In terms of single father households, the demographic groups most similar to Immigrants from Sierra Leone are Immigrants from Oceania (2.5%, a difference of 0.010%), Sierra Leonean (2.5%, a difference of 0.030%), Cajun (2.5%, a difference of 0.080%), Immigrants (2.5%, a difference of 0.13%), and African (2.5%, a difference of 0.15%).
| Demographics | Rating | Rank | Single Father Households |
| Immigrants | Nonimmigrants | 7.6 /100 | #231 | Tragic 2.4% |
| Pennsylvania Germans | 7.3 /100 | #232 | Tragic 2.4% |
| Immigrants | Western Africa | 7.0 /100 | #233 | Tragic 2.4% |
| Africans | 6.3 /100 | #234 | Tragic 2.5% |
| Immigrants | Immigrants | 6.3 /100 | #235 | Tragic 2.5% |
| Cajuns | 6.1 /100 | #236 | Tragic 2.5% |
| Sierra Leoneans | 5.9 /100 | #237 | Tragic 2.5% |
| Immigrants | Sierra Leone | 5.8 /100 | #238 | Tragic 2.5% |
| Immigrants | Oceania | 5.8 /100 | #239 | Tragic 2.5% |
| Immigrants | Dominica | 4.8 /100 | #240 | Tragic 2.5% |
| Portuguese | 4.1 /100 | #241 | Tragic 2.5% |
| Osage | 4.1 /100 | #242 | Tragic 2.5% |
| Spaniards | 3.1 /100 | #243 | Tragic 2.5% |
| Immigrants | Middle Africa | 2.8 /100 | #244 | Tragic 2.5% |
| Basques | 2.5 /100 | #245 | Tragic 2.5% |